#92 · Added Graph Visualization in the Inventory
We’ve added a powerful new feature: the API Lifecycle Graph within the Inventory. This visualization allows you to see an in-depth view of your API service, including its lifecycle and key integration details.
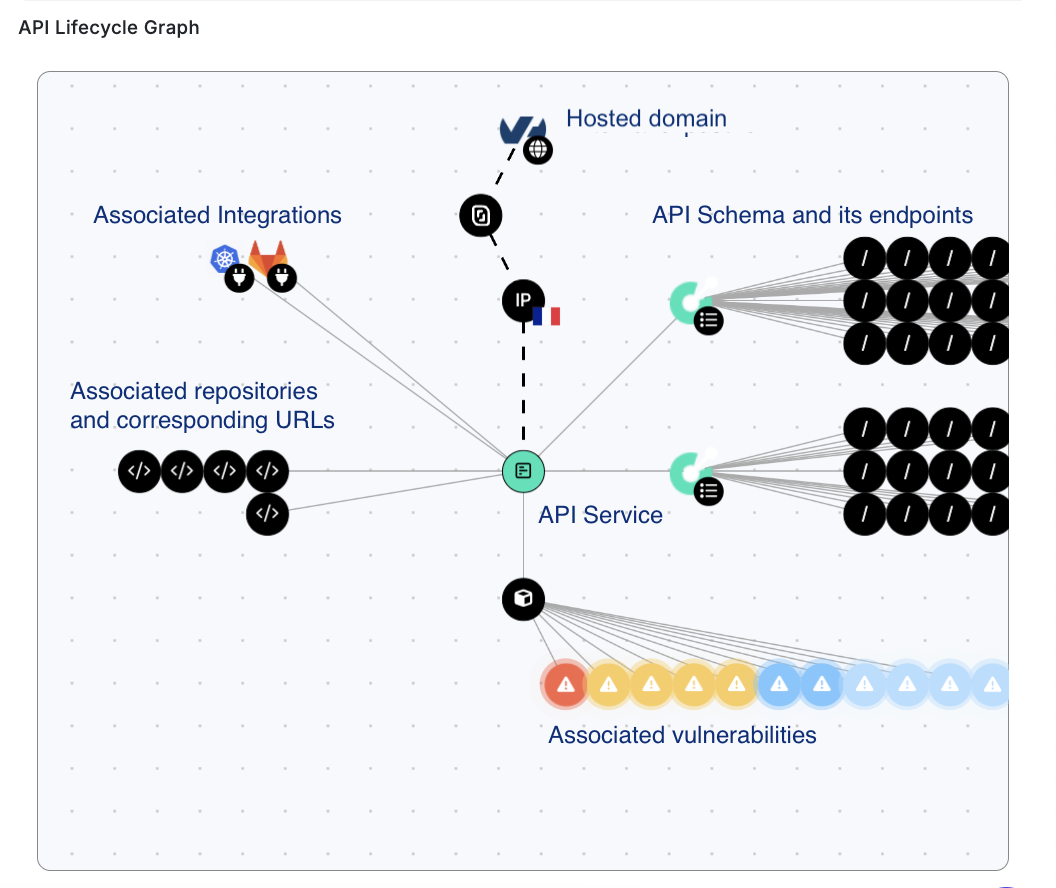
What you can view:
- API Lifecycle Graph: View the full lifecycle of the API service.
- Hosting Details: Know the domain where the API service is hosted, the cloud provider, the associated IP address, and the country where it’s hosted.
- Service Integration: See the integration with Wiz, GitHub, GitLab, Kubernetes or others and how it was set up (e.g., via GitLab API key).
- Repository Info: Identify the repository and associated URL where the service is hosted.
- API Schema: View the associated API schema, how it was generated or found, and its endpoints with the methods linked to each endpoint.
- Application Scan: See which application scan is associated with the service and view alerts linked to that application. Each alert is color-coded depending on its severity.
How to view:
- Go to Inventory → All Services.
- Click on the service you want to inspect.
- You'll find the API Lifecycle Graph at the bottom of the Overview tab.
Benefits:
- Complete Lifecycle Visibility: The API Lifecycle Graph provides a comprehensive view of your API’s entire journey, from integration to deployment.
- Simplified Troubleshooting: By visualizing the API's integration and hosting details, you can easily identify potential points of failure or misconfigurations.
- Better Monitoring and Tracking: Track the service repository, schema, and its endpoints efficiently in one place, making it easier to manage and secure your APIs.
- Contextual Insights: View associated scans, vulnerabilities, and alerts in context, allowing you to quickly assess the security posture of your API services.
We hope that visually representing all relevant information helps you make informed decisions faster and improves your ability to monitor, manage, and secure your APIs effectively!