Skip to content

DAST

#171 · ASM Login and CAPTCHA Detection: See Auth Friction on Every Web App

Availability: General Availability

Every ASM web app scan now fingerprints the login surface before you touch scan profiles. You get the login requirement, login page URL, registration path, SSO providers, auth protocol, auth technology, and CAPTCHA provider on each asset. AppSec teams told us they need this context upfront: which apps gate sign-in with MFA or CAPTCHA, and where SSO redirects land, before they configure authenticated DAST or plan allowlists.

What's new:

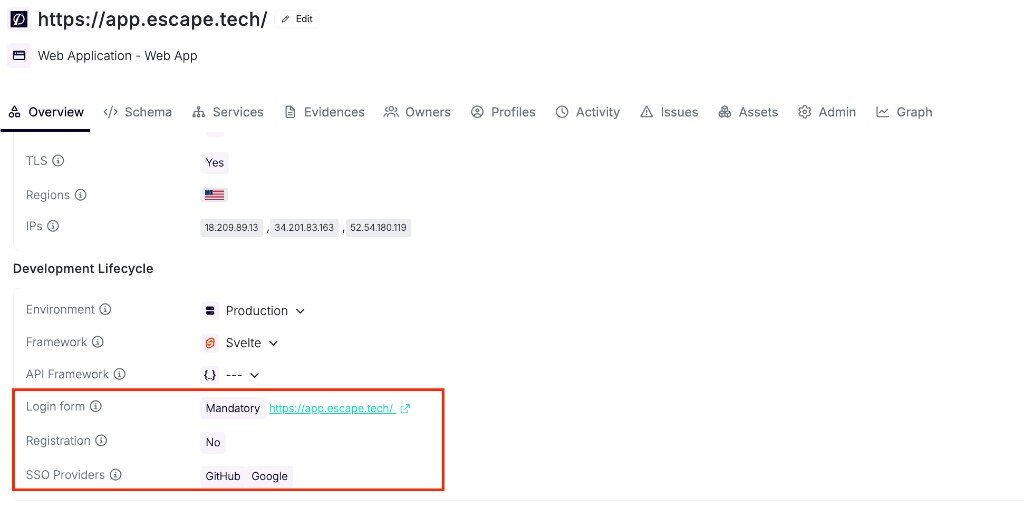
  • Login page discovery: an agent browses each web app and records whether login is mandatory, optional, or absent, plus the login page URL and detected SSO providers. Asset overview panel showing mandatory login form with login page URL and detected SSO providers GitHub and Google

  • Auth fingerprinting: HTTP probing and redirect analysis classify auth protocol and technology (OAuth, OIDC, Auth0, Cognito, and similar) on web apps, REST APIs, and GraphQL APIs.

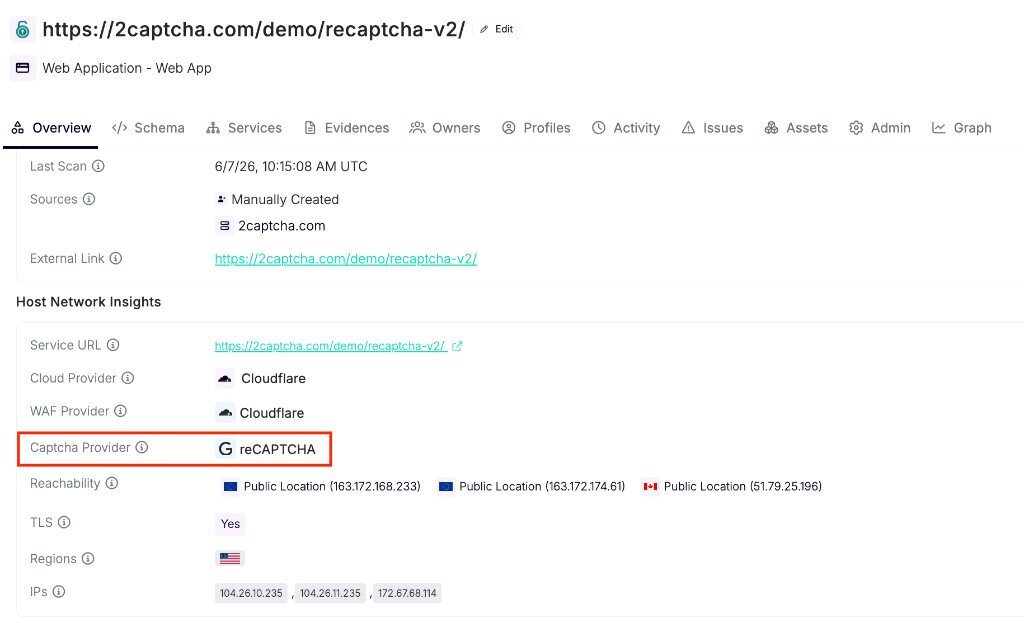
  • CAPTCHA provider detection: dual fingerprinting via HTTP technology signatures and browser rendering flags reCAPTCHA, hCaptcha, Cloudflare Turnstile, and other providers on each frontend.

    Asset overview panel showing reCAPTCHA listed as the captcha provider in Host Network Insights

  • Filters: filter web apps by CAPTCHA provider and review login and auth fields from the asset side panel.

Asset Management documentation →

Questions?

Have a question? Reach out on your dedicated support channel, or email us at support@escape.tech.

#164 · Email-Based Authentication: Cover Logins Behind Email OTPs

Availability: General Availability

Many apps send a one-time code or a magic link by email at sign-in. Until now, that single step was enough to keep an authenticated DAST scan stuck at the login page. Escape now provisions managed scan email addresses the scanner reads on its own, so the rest of your application finally becomes testable end-to-end.

What's New

  • Managed scan inboxes: Escape provisions email addresses under @scan.escape.tech tied to your organization, so you don't have to share a real inbox with the scanner.
  • Email OTP support: the scanner waits for the email, extracts the verification code, and types it into the login form without manual help.
  • Magic link support: when the app sends a clickable sign-in link, the scanner follows it the way a real user would.
  • Works with the Agentic Browser: plain-language instructions are enough, and they're even optional. The AI browser detects the email step on its own.

Why It Matters

Email-gated logins are everywhere: SaaS portals, internal admin consoles, and any flow built around passwordless sign-in. Without managed inboxes, AppSec teams either kept these apps out of scope or fell back on test accounts with static codes, leaving real authenticated paths untested. Now that Escape reads the inbox for you, you don't lose coverage every time an app sends a code by email, and authenticated business-logic findings surface where they actually hide: behind the login.

How to Get Started

  • Pick a scan email address: <alias>.<your-org-id-first-segment>@scan.escape.tech. You'll find your organization ID on the Organization general settings page.
  • Reference it as the username in your authentication preset. With the Agentic Browser, plain-language instructions handle the rest. With Browser Actions, use fill_email_totp for codes or click_mail_magic_link for magic links.

Learn More

Questions?

Have a question? Reach out on your dedicated support channel (Slack, Microsoft Teams, or whichever channel we've set up with your team), or email us at support@escape.tech.

TLDR: General Availability: Discover how AI agents can now list DAST schemas with signed URLs and jump from any issue to its latest events in one Public API call.

AI agents that drive DAST through Escape's Public API used to lose two hops on the most basic questions: "where's the schema for this profile?" and "what events produced this issue?". Starting today, the profile detail carries the schema's signed URL alongside its metadata, and the issue detail links straight to the latest events from the scan that surfaced it. The CLI ships matching one-command wrappers so an agent can go from profile to schema, or from issue to full request-response evidence, in a single call.

What's New

  • Schemas on the profile detail: GET /v3/profiles/:profileId now returns signedUrl and isActive on every extraAssets[] entry. No more re-fetching each asset just to get a download link.
  • Issue to events link on the issue detail: GET /v3/issues/:issueId now returns latestEventIds (up to five, newest-first, from the issue's last-seen scan) and latestEventsTruncated so agents know when to paginate.
  • One CLI command per intent:
    • escape-cli profiles get-schema <profile-id> prints the active schema's metadata; add -f <file> to download the bytes via the signed URL in the same call.
    • escape-cli profiles upload-schema <profile-id> --file <path> uploads, creates the schema asset, and attaches it to the profile in one shot.
    • escape-cli issues get-with-events <issue-id> hydrates every latest event, including the full request-response Exchange, in a single MCP tool call.

Why It Matters

Customers who drive Escape at scale do it programmatically, and the feedback we hear most often on customer calls is consistent: agents and CI pipelines want handy commands that wrap multiple steps, not granular flows that mirror the database. Getting a schema used to take two round trips per asset. Attaching a freshly uploaded schema to a profile used to take three different surfaces, one of them undocumented. Navigating from an issue to the events that produced it used to require knowing the event IDs up front.

That's fixed. An agent can now go from a profile id to a downloadable schema in one call, and from an issue id to the actual request-response evidence in one MCP tool call. Triage gets shorter. CI jobs get simpler. MCP-powered tools get to answer real questions instead of stitching together two or three lookups.

The changes land on the detail endpoints only. List endpoints stay unchanged, so there's no fan-out on GET /v3/profiles or GET /v3/issues, no per-profile signed-URL minting on list calls, and no surprise cost or exposure bump for callers that page through collections.

How to Get Started

No flag, no toggle, no configuration: both changes are on for every organization.

  • Public API: fetch a profile with GET /v3/profiles/:profileId and read the new signedUrl and isActive fields on each extraAssets[] entry (signedUrl is non-null only for class === 'SCHEMA'). Fetch an issue with GET /v3/issues/:issueId and read latestEventIds and latestEventsTruncated; hydrate each event with GET /v3/events/:id to get the Exchange.
  • CLI: upgrade to the latest escape-cli. The new commands are profiles get-schema, profiles upload-schema, and issues get-with-events. The existing escape-cli issues get table also gains a LATEST EVENTS column.
  • MCP: the Escape MCP server picks up issues_get_with_events automatically, so agents get the one-call hydration path without any configuration.

Compatibility

Scoped to the Public API wire contract and OpenAPI spec.

Hard-breaking changes

None.

Soft-breaking changes

Wire payloads and HTTP status codes are unchanged. Regenerated SDKs and strongly-typed consumers will see new optional fields.

  • GET /v3/profiles/:profileId response: ProfileExtraAsset now includes two additive fields, signedUrl (nullable string, non-null only for class === 'SCHEMA') and isActive (boolean). Regenerated SDKs expose new accessors. Existing hand-written parsers keep working; the fields are additive.
  • GET /v3/issues/:issueId response: IssueDetailed gains two optional fields, latestEventIds (array of opaque string IDs, GraphQL ID scalars, not guaranteed UUIDs, maximum five, newest-first) and latestEventsTruncated (boolean). Because IssueDetailed is reused inside EventDetailed.issues[], strongly-typed SDK consumers of GET /v3/events/:id will see the typed surface widen. The wire payload of GET /v3/events/:id stays byte-identical: the route never sets these fields.

Non-breaking changes

  • List endpoints untouched: GET /v3/profiles and GET /v3/issues return the same payloads as before. The enrichment is deliberately scoped to the single-resource detail endpoints to avoid fan-out.
  • No new routes, no authentication changes, no status-code changes, no new top-level resource group. Schemas remain modeled as assets.

What's Next?

Regular improvements to the Public API and the CLI, guided by what we hear on customer calls.

Learn More

Questions?

Have a question? Reach out on your dedicated support channel (Slack, Microsoft Teams, or whichever channel we've set up with your team), or email us at support@escape.tech.

#155 · Multi-Schema Support for Scan Profiles

APIs built on microservices often have one schema per service. Scanning them together meant merging files manually or accepting gaps in your security coverage.

Now you can attach multiple schemas to a single scan profile. Your full API surface gets tested, without the prep work.

What's new

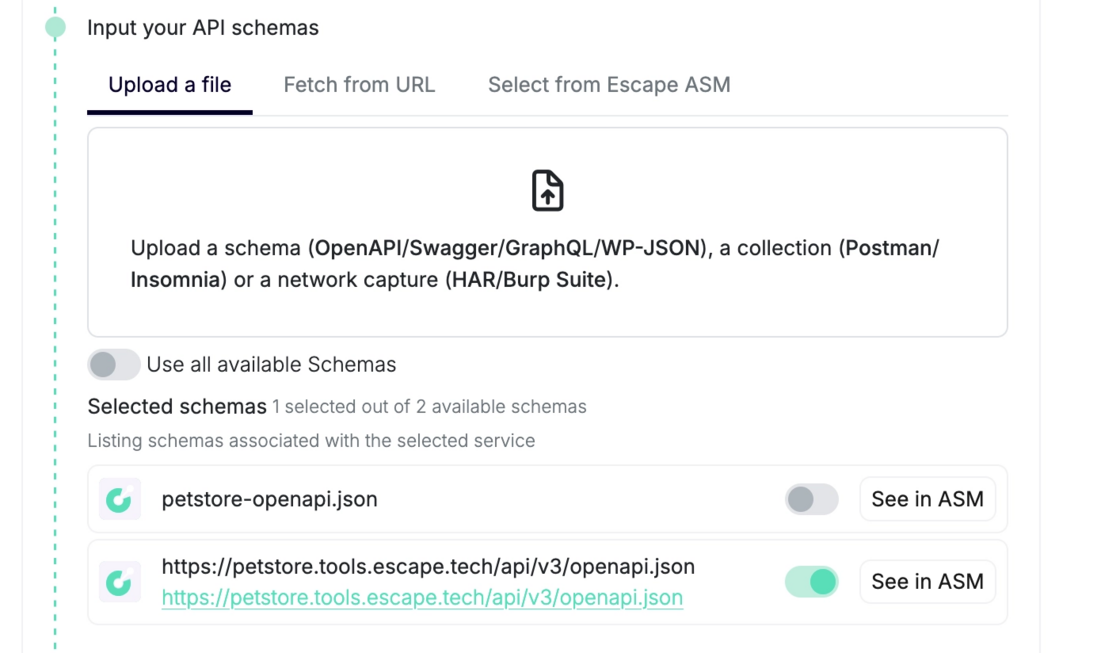
  • Manage schemas from two places. Use the profile's Schemas section in Settings, or the service's side panel in the ASM.
  • Attach schemas during profile creation. Pick from existing assets, or create new ones on the fly via upload, fetch, or directly from the ASM.
  • Scan APIs using multiple schemas. All attached schemas are used during the scan.

How to use it in the UI:

  • During profile creation:
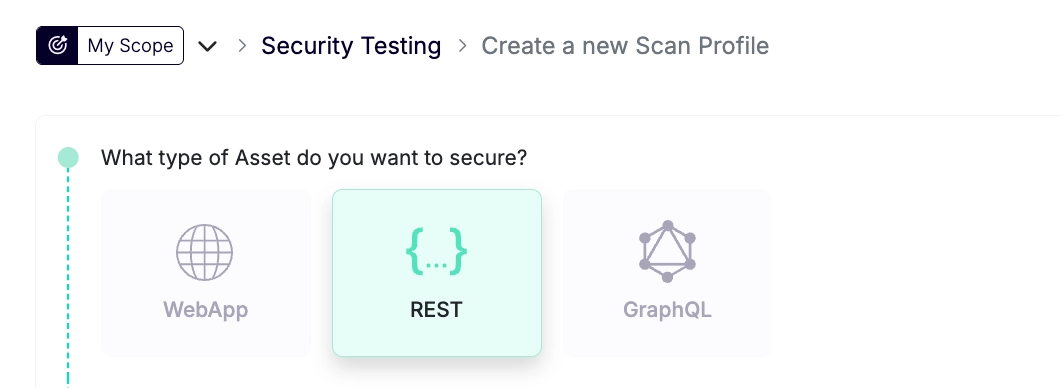
    • Go to the "Create a new scan profile" step and select your API type.

image.png

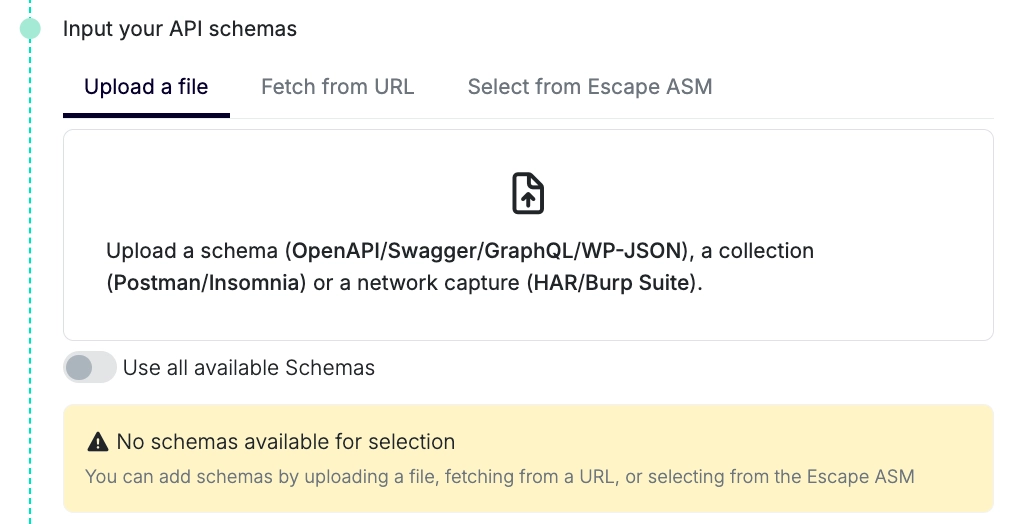
  • If a schema doesn't appear in the list, it may not be linked to the target asset yet.

image.png

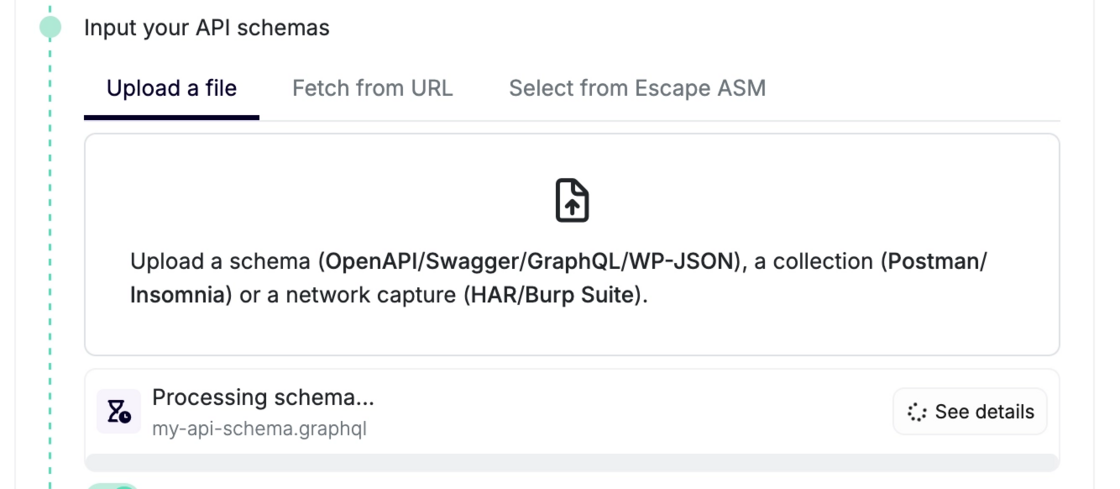
  • Create it on the fly:

image.png

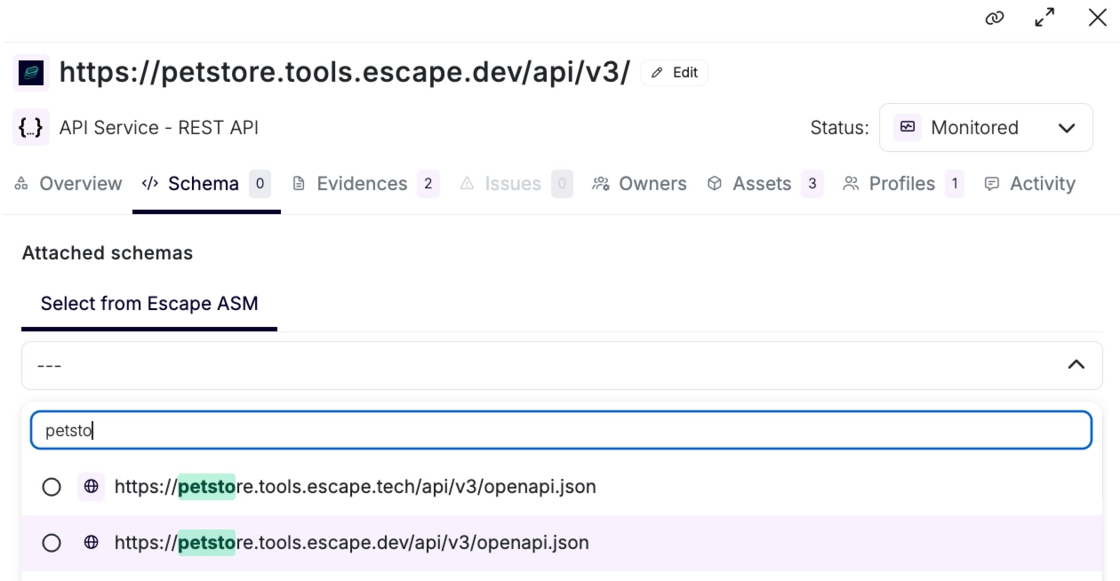
  • or link it first from the ASM:

image.png

If schema(s) are available, toggle on the schemas you want to include. Check "Use all available extra assets" to always include every linked schema automatically.

image.png

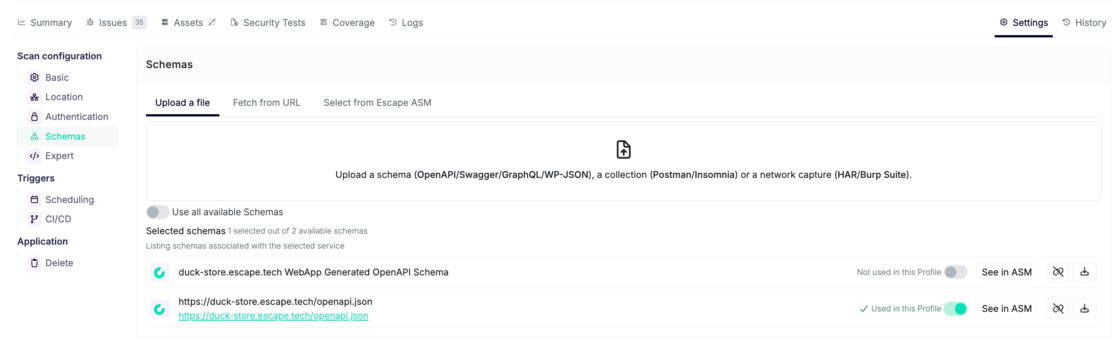
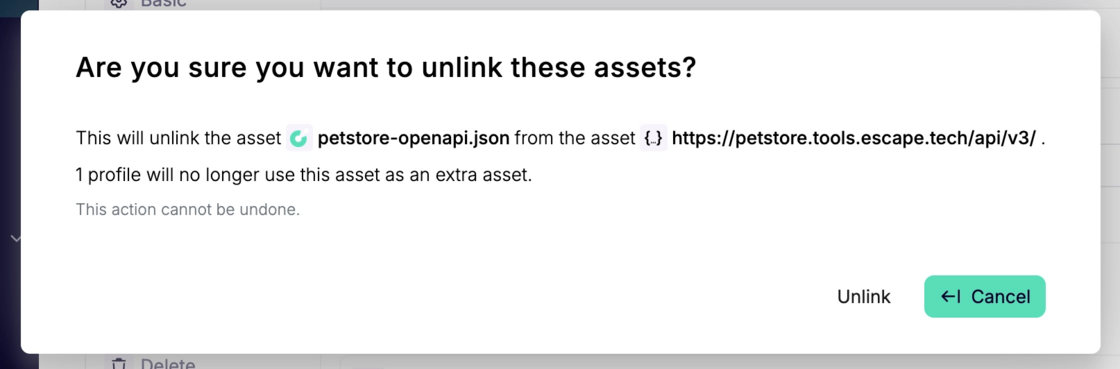
  • For existing profiles: Go to Settings → Schemas. Add, remove, or unlink schemas anytime. Unlinking removes the schema from all profiles scanning that target.

image.png

Unlinking extra schemas from a target asset will require a confirmation and it will remove the asset from the extra assets of all the profiles scanning the target asset.

image.png

The more schemas your scan profile includes, the closer your security coverage gets to your real attack surface.

For extra setup guidance and troubleshooting, learn more in the docs.

#152 · New Integrations page with built-in testing, logs, and project-level organization

The Integrations page in Escape has been redesigned to make integrations easier to manage and troubleshoot. You can now configure, test, and monitor integrations from one place, with clear insight into associated assets, execution history, and usage across workflows.

By separating integrations from asset scope and adding built-in testing and logs, it’s simpler to validate changes, debug issues, and keep integrations organized by project as you scale.

What’s new

Standalone integrations

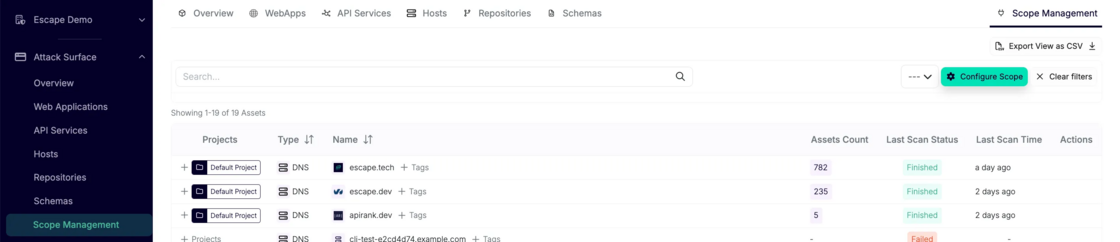
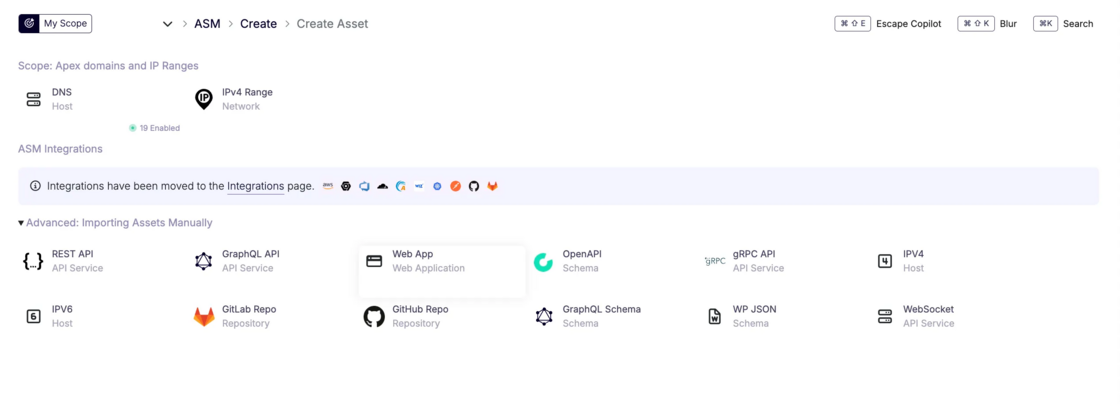
Integrations and asset scope are now managed separately. Domains and IP ranges are handled under ASM Scope Management, while integrations focus only on connectivity and execution.

Configure and manage assets in ASM via Scope Management:

image.png

image.png

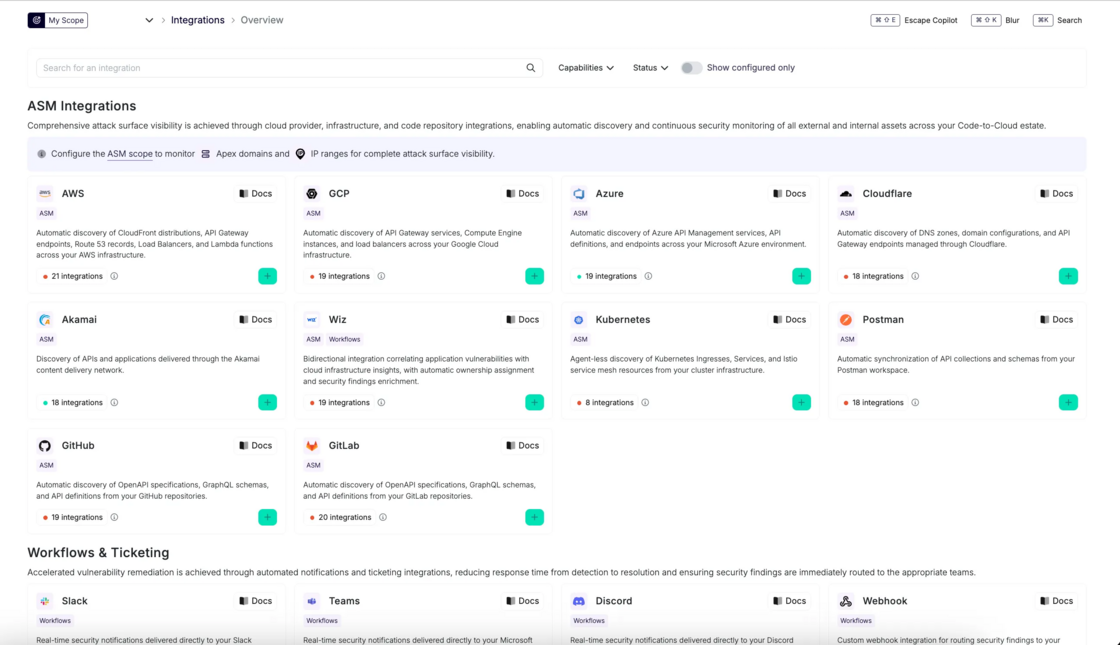
Manage integrations independently at a dedicated Integrations page:

image.png

  • Keep scope and connectivity as separate concerns

This makes it easier to reason about what connects vs. what’s being scanned.

Project-level organization

You can now organize integrations based on how your team actually works.

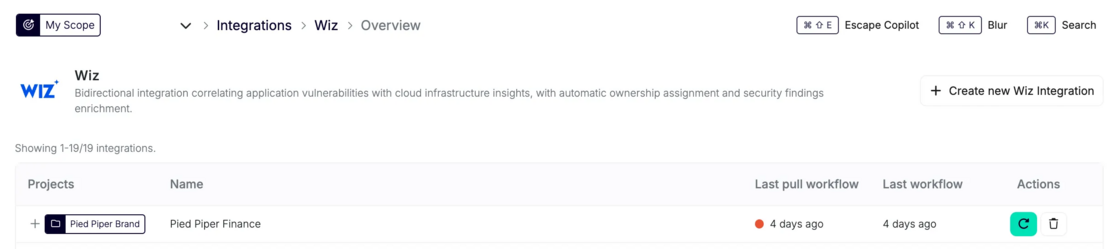
  • Link each integration to a specific project (for example, Brand A)

image.png

  • Create multiple integrations for different environments (staging, prod etc.)
  • Manage integrations independently across teams or setups

Makes it simpler to scale without everything living in one shared config.

Built-in testing

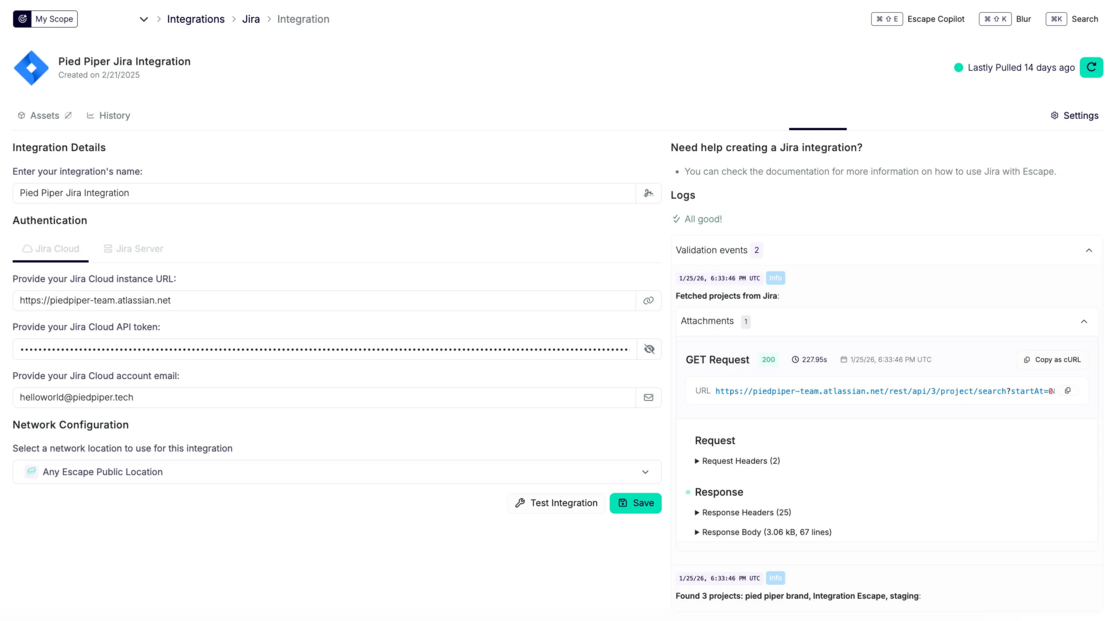
Validate integrations before using them in workflows in a single click on “Test configuration”

image.png

  • Run tests directly from the UI during your initial set up or if you’re making changes.
  • Inspect requests and responses
  • Catch misconfigurations early

Fewer broken workflows and less trial-and-error.

Usage logs

Understand how integrations behave in practice.

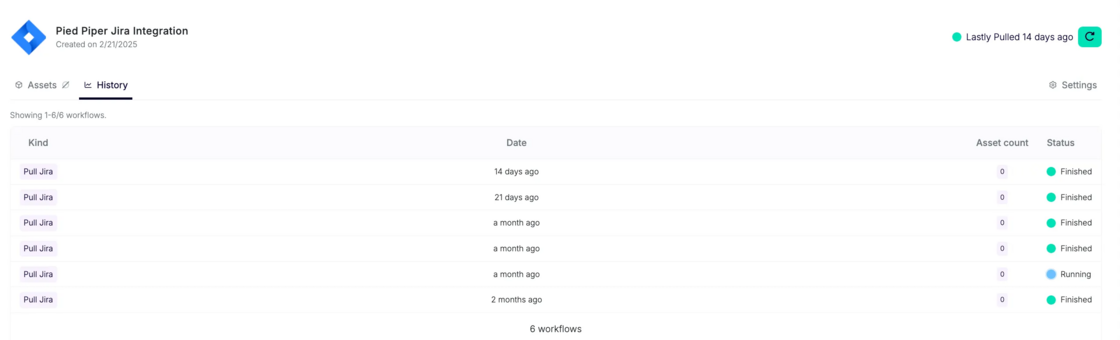
  • Click on History on a specific integration’s page and see exact when an integration ran

image.png

  • Identify which workflow triggered it
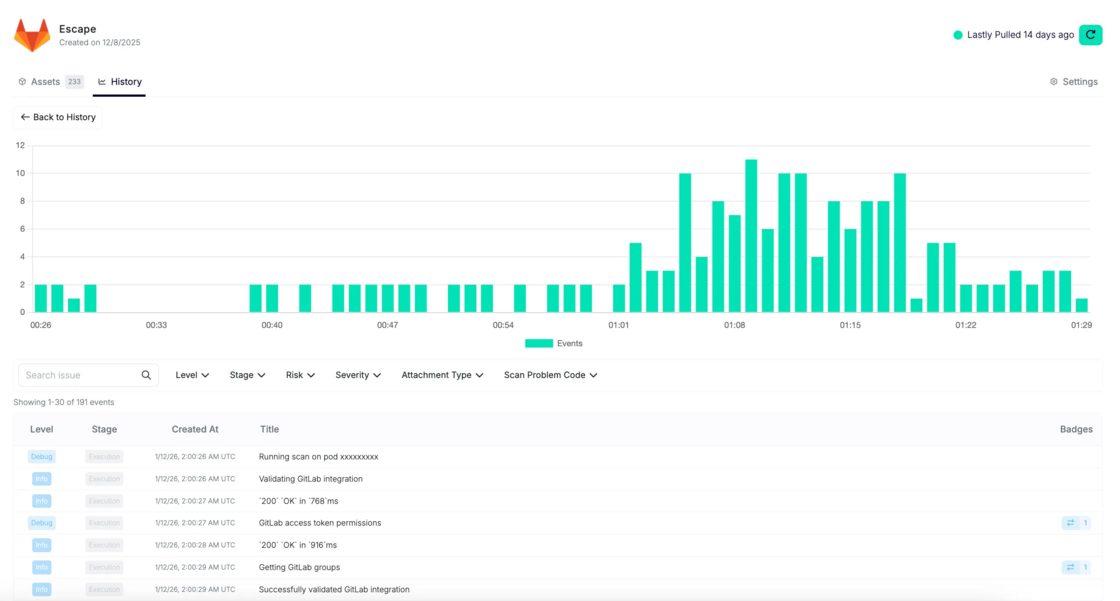
  • Review in-depth execution history by clicking on a specific pull for debugging

image.png

Your troubleshooting faster and more predictable.

Asset scope insight & export: Helpful for governance and reporting

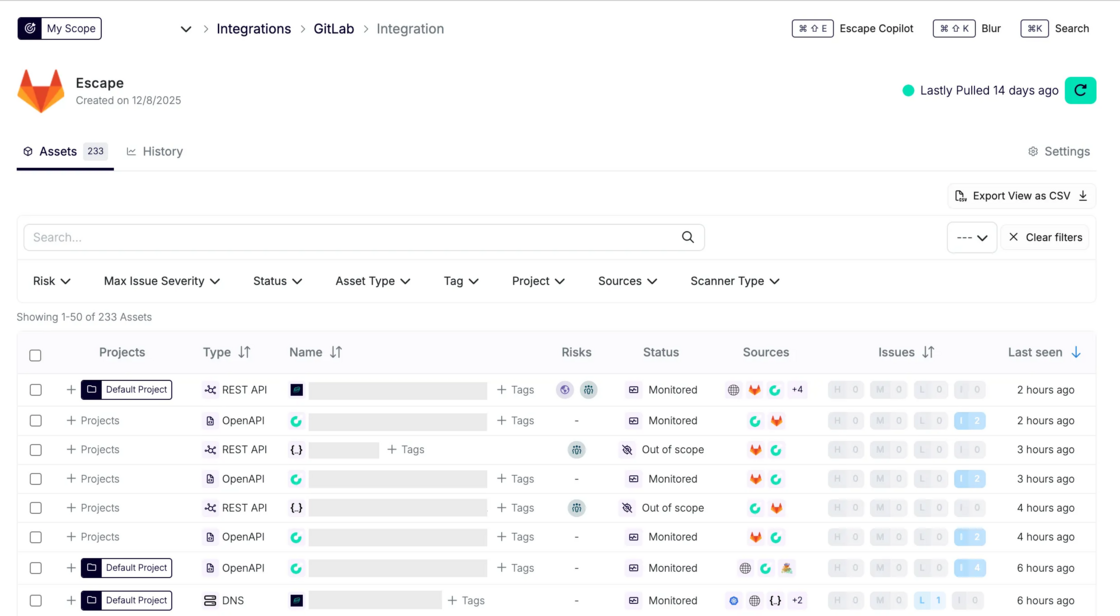
For Attack Surface Management users: you can now exactly see which assets are associated with each integration.

image.png

And also export associated assets as CSV for audits or reviews:

image.png

Workflow-native messaging integrations

Create Slack, Discord, and other messaging integrations directly inside workflows, where they’re used.

Result: less setup friction and cleaner configuration.

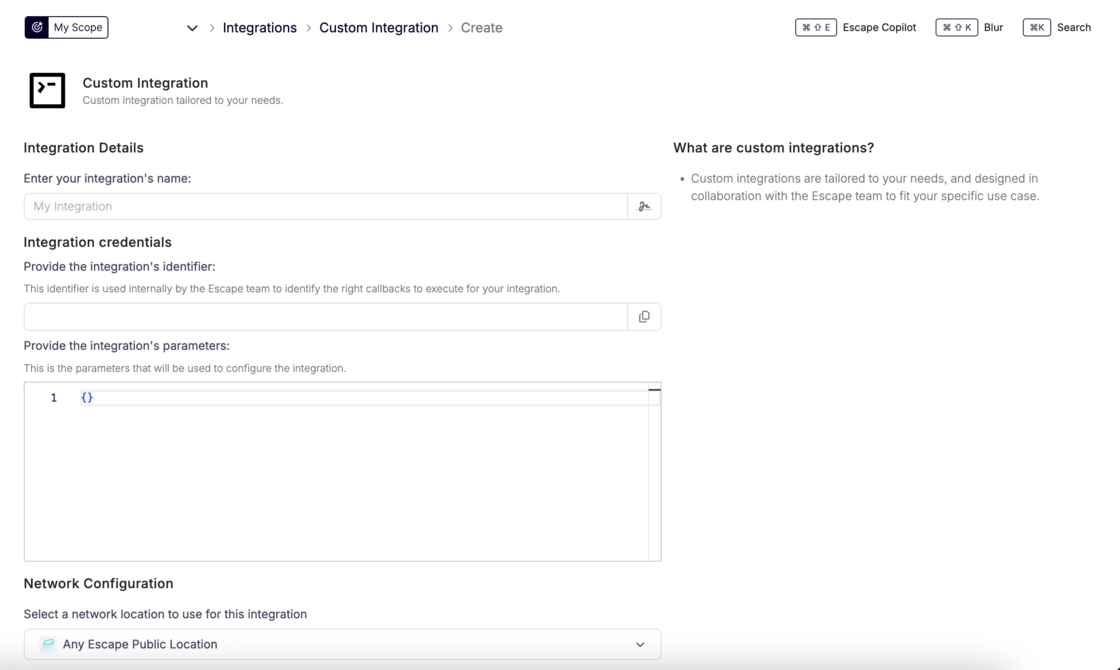
Custom Integrations (on request)

Need something tailored?

Collaborate with the Escape team to design a custom integration built specifically for your use case.

image.png

Why this matters

Previously, integrations were harder to reason about:

  • Limited visibility into dependent assets and workflows
  • Manual debugging when failures occurred
  • Little insight into usage or performance
  • Confusion between asset scope and connectivity

Now, you get:

  • Clear separation between asset scope and integrations
  • Built-in testing to validate configurations
  • Usage logs for debugging and traceability
  • Project-level organization across environments

This makes integrations easier to manage, troubleshoot, and scale as your setup grows.


Learn more in the docs

#151 · Scope Configuration Update – Action Required

We’ve simplified and unified scope configuration across all scanners (ASM + DAST) to make allowlists and blocklists easier to manage.

All scanners now use a single, consistent scope model to define:

  • What should be tested or crawled
  • What should be explicitly allowed or excluded

This brings more consistency, safer defaults, and clearer behavior across frontend, REST, and GraphQL scans.

Each scanner supports:

  • A global scope (shared across scanners)
  • Scanner-specific scope extensions
  • Unified allowlist and blocklist rules (domains, URLs, API paths, GraphQL operations, page elements, etc.)

Below is an example of what changed:

BEFORE
frontend_dast:
  scope:
    api:
      blocklist:
          - ^(?!.*\/api\/v2\/on-call).*
AFTER (AUTO-MIGRATION)
 rest_api_dast:
  scope:
    allowlist: []
    blocklist:
      - type: rest_api_path
        value: ^(?!.*\/api\/v2\/on-call).*
        operation: regex
AFTER (MANUAL MIGRATION WITH WILDCARDS)
rest_api_dast:
  scope:
    allowlist: 
      - type: rest_api_path
        value: "*/api/v2/on-call*"
        operation: wildcard

Action required for customers using scope configuration in CI/CD: you need to upgrade your configuration to the new unified scope format.

Existing configurations were migrated automatically where possible, but CI/CD setups relying on scope definitions must be updated to ensure scans keep working as expected.

For more information on scope configuration, new naming and structure, please refer to our documentation.

#149 · Redesigned Web Application Coverage with Screenshots and Pentesting Summaries (Beta)

We reworked how Escape represents dynamic security testing coverage across web applications, with one goal:

Make every executed action observable, verifiable, and explainable. We strongly believe every app is different, and just showing visited URLs is not enough.

Screenshot 2026-01-16 at 17.22.52.png

What’s New for Web Applications (At Glance)

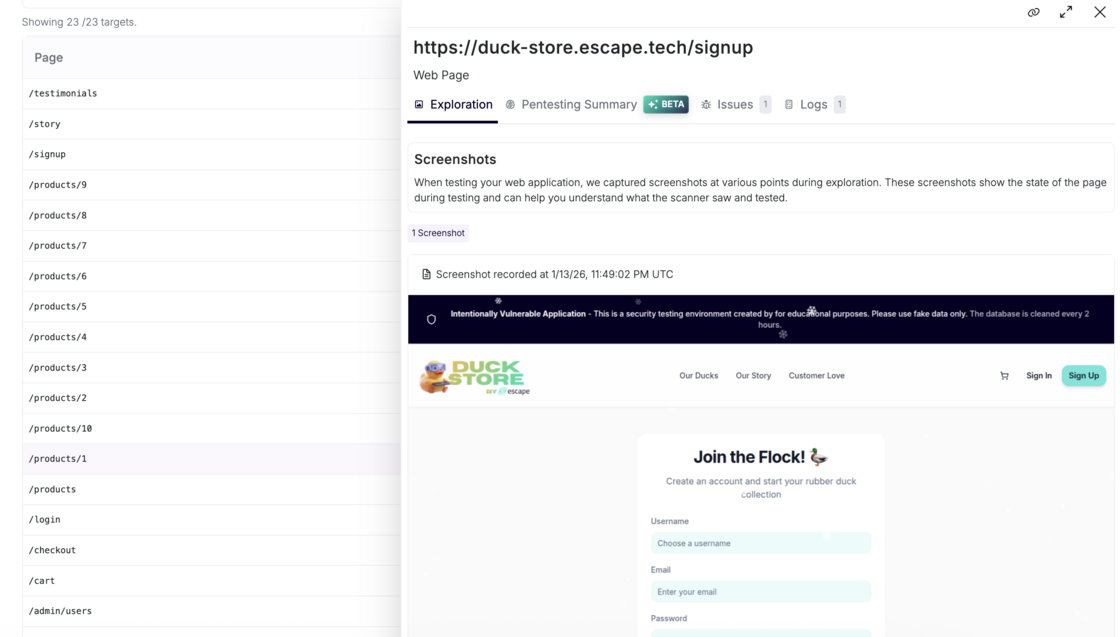
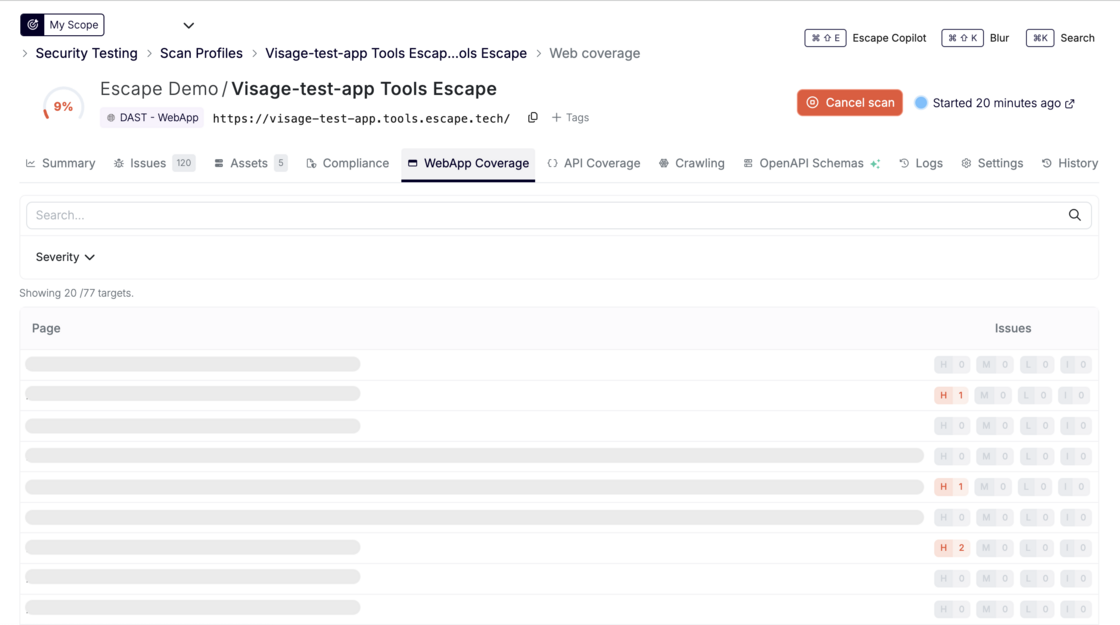
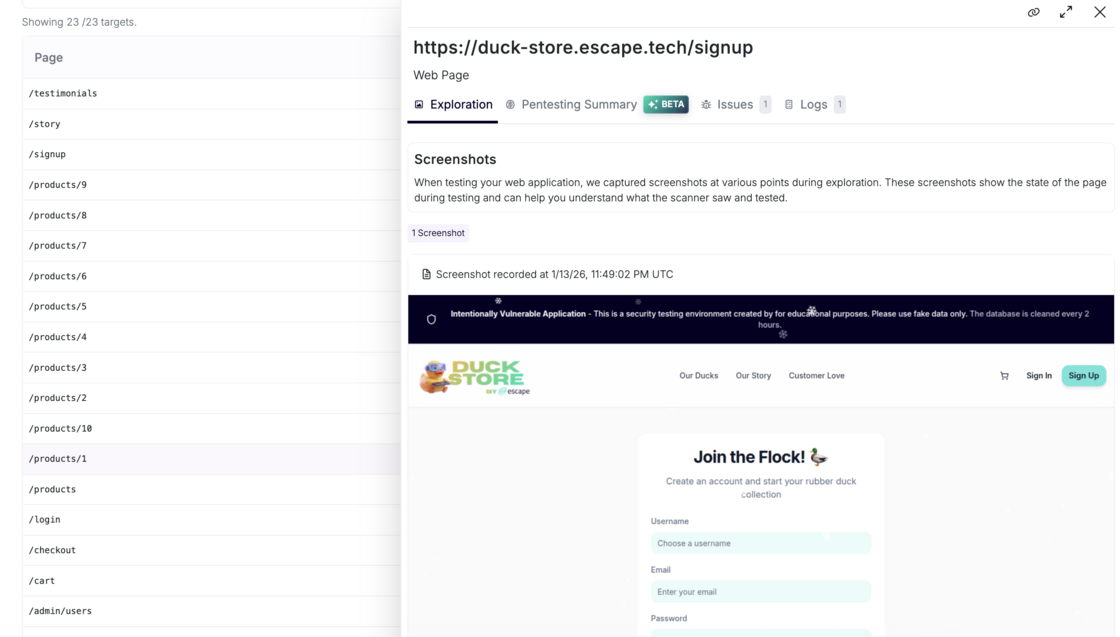
  • Web Application Coverage showing all tested pages and states
  • Screenshots captured during exploration, including dynamic SPA states
  • Search and filtering to validate that specific routes were tested
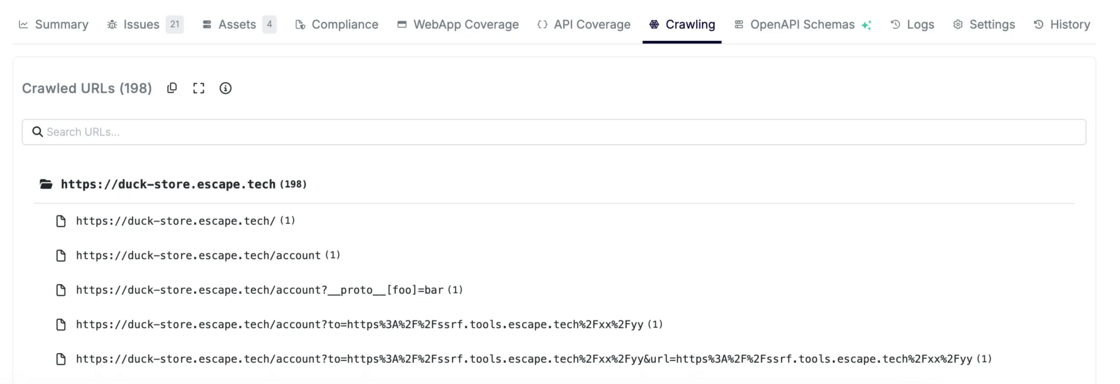
  • Dedicated Crawling view listing all discovered pages in a folder-based structure
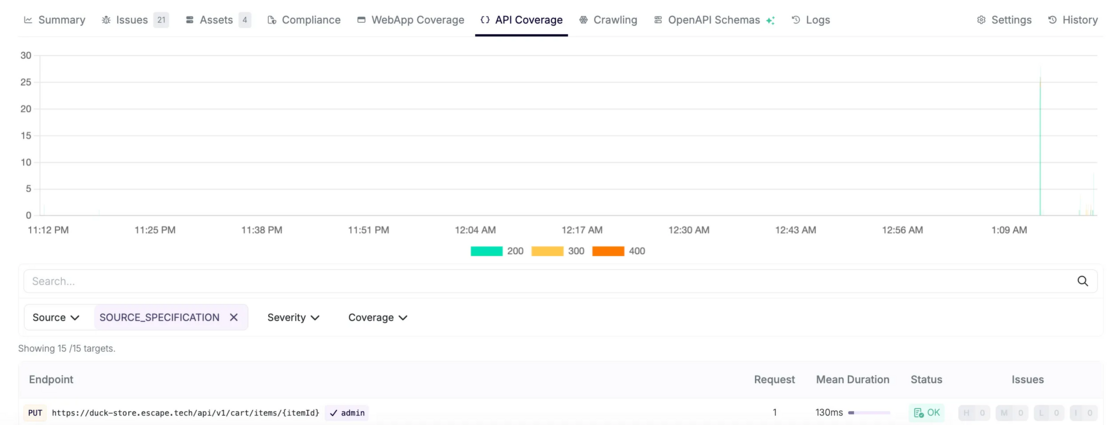
  • API Coverage for web-triggered API calls, with the same attack path exploration graphs and visibility as API-first scans
  • Unified Logs page shared across web and API testing for full end-to-end traceability

Screenshot 2026-01-16 at 17.21.48.png

Now, we help your team to answer the following questions:

  • Is the scanner getting good broad coverage?
  • Did authentication succeed, and where did it fail?
  • Which attack paths succeeded or weren’t tested?

This update makes Escape’s exploration and testing fully transparent, end-to-end. You can prove what was tested, troubleshoot gaps instantly, and stop defending your security tooling.

Web Application Coverage Page

Escape now shows:

1. Coverage with Screenshots

Every unique application state reached during the crawl is:

  • Captured as a screenshot

Screenshot 2026-01-16 at 17.22.52.png

  • Associated with a logical route
  • Searchable and filterable by severity
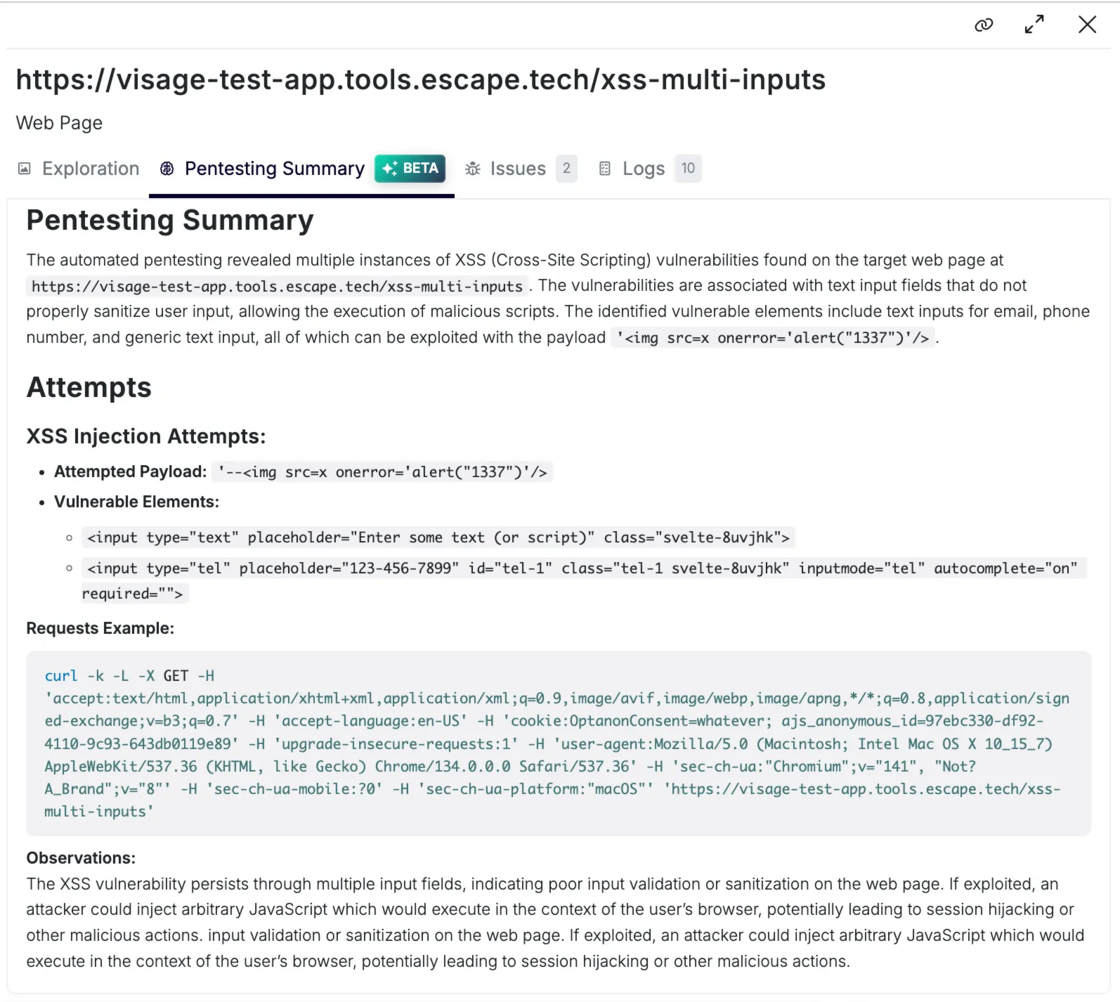
2. Pentesting summary (Beta)

Beyond screenshot validation, Escape delivers AI-generated summaries that break down how vulnerabilities associated with a specific page were uncovered and precisely which attack attempts led to its discovery:

image.png

3. Associated Issues

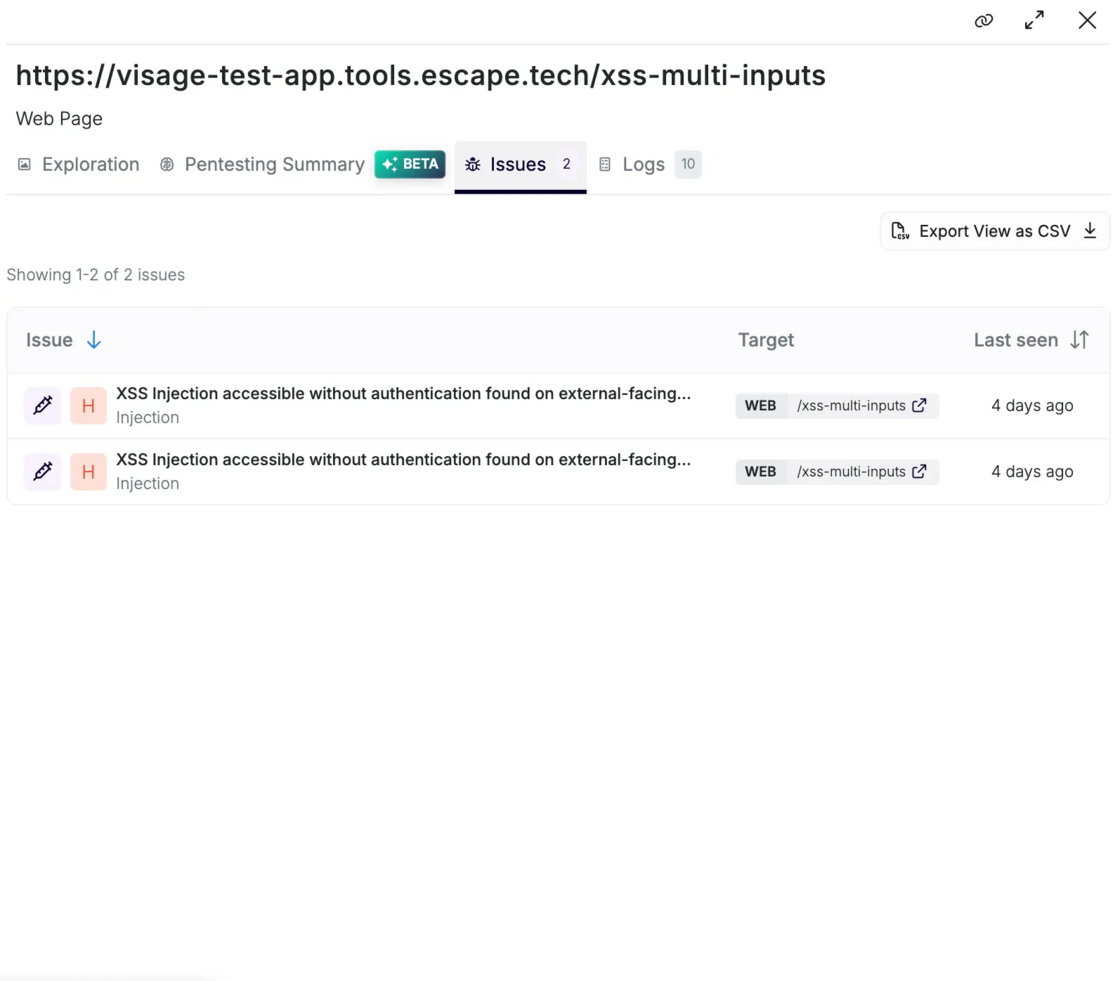
In a dedicated tab, you can view all issues linked to this specific web page, giving you immediate visibility into what was found and where.

image.png

No more guessing whether a given page was touched during scanning.

Behind the scenes: Escape’s RL-driven web crawler identifies similar page states and avoids redundant visits — now you can see exactly which unique states were tested and why.

Crawling View

image.png

A structured list of all discovered pages organized by folder and hierarchy. This makes it easy to:

  • Validate that important areas of the site were exercised
  • Cross-reference against your sitemap
  • Spot blind spots in discovery

API Coverage Within Web Testing

When web crawling triggers API calls (XHR/Fetch), those same coverage and attack path visualisation capabilities apply — giving you:

  • Unified API visibility
  • Integration into Attack Path Validation graphs
  • Proven evidence of how frontend and backend interactions were exercised

This gives you end-to-end visibility, from UI action → API call → vulnerability.

image.png

With this release, Escape shifts dynamic testing from a black box to a glass box.

You don’t just see results of the scan, you see:

  • How coverage was achieved
  • Why authentication might have failed
  • And where your real attack surface lies

Whether you’re validating that a critical part of a web app was tested, debugging a failed scan, preparing for an audit, or reviewing a production incident, Escape gives you the right evidence.

#147 · Improved Scan Logs Page: Stop Debugging Scans Blind and Improve Your Scan Performance

Escape’s improved Logs page gives you a complete, chronological view of everything that happens during a scan — and, crucially, why it happens.

By making every scanner decision, skip, and failure fully visible, Logs help you quickly diagnose issues, fine-tune configurations, and continuously improve scan coverage and reliability.

The result: less guesswork, faster debugging, and better scans over time.


What you’ll see in the Logs page

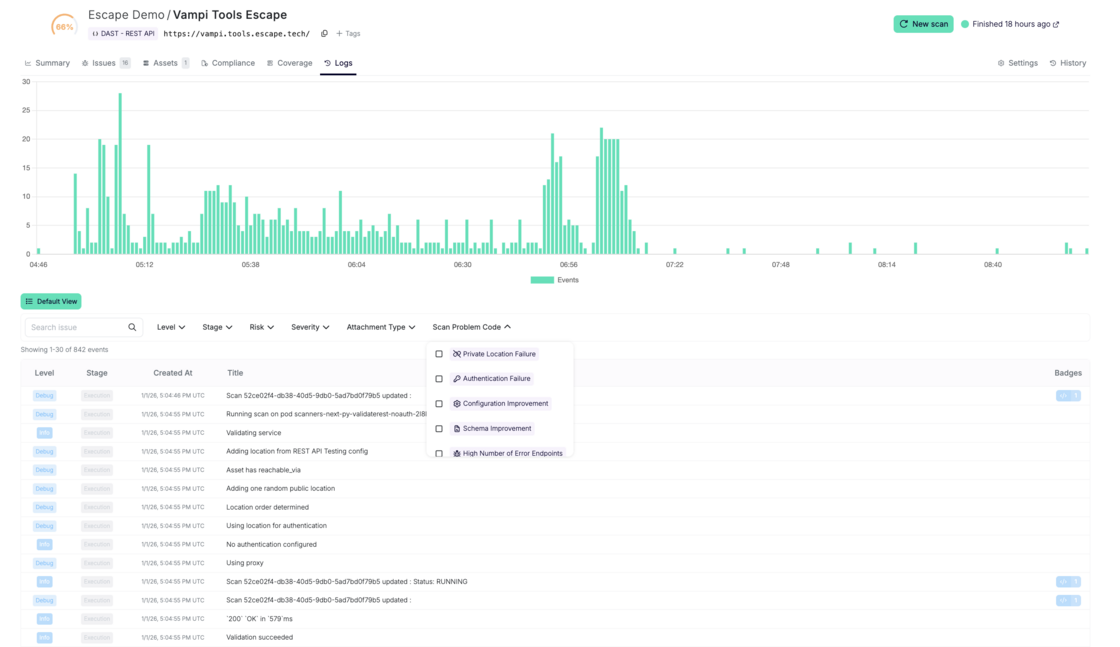
The Logs page shows every event associated with a scan, including:

  • Configuration steps (schema download, auth detection, proxy usage)
  • Execution steps (requests, responses, mutations)
  • Issues found
  • Agentic LLM reasoning and decisions (when enabled)

vampi-logs.png

It helps to answer the following questions like

  • "Why didn't the scanner find anything?" → It was blocked by your WAF, but you didn't know
  • "Why is coverage so low?" → Authentication failed during the scan

You can search and filter logs by:

  • Log level (debug, info, warning, error)
  • Scan stage (configuration, execution, agent actions)
  • Risk type (unauth access, sensitive data, external exposure…)
  • Escape severity
  • Scan problem codes (auth failure, WAF block, unreachable asset, timeout…)

to help you troubleshoot scan problems instantly:

  • Filter by "Scan Problems" → see "Authentication Failure" logged at 8:04:26 AM → fix auth config → rescan
  • Filter by "Blocked by WAF" → see exactly which requests triggered blocking → whitelist scanner IP
  • Filter by "Rate Limit Exceeded" → adjust scan before next run

Each log entry is evidence-backed:

  • Full request and response
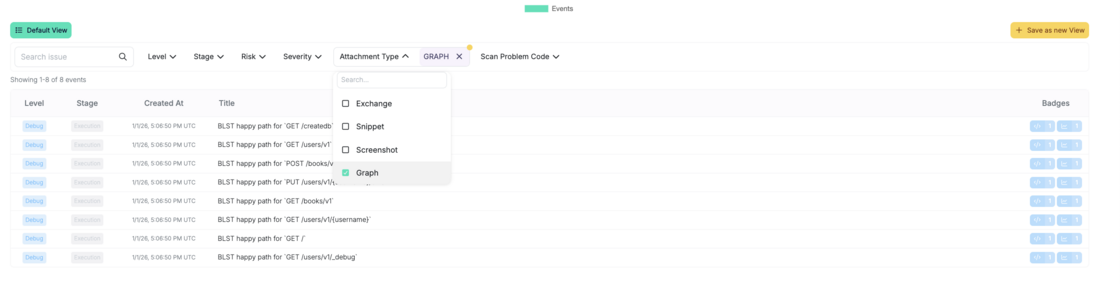
  • Attachments (exchange, snippet, attack validation path graph - to highlight when the execution path from the Escape business logic security testing engine was generated:

Screenshot 2026-01-02 at 12.28.05.png

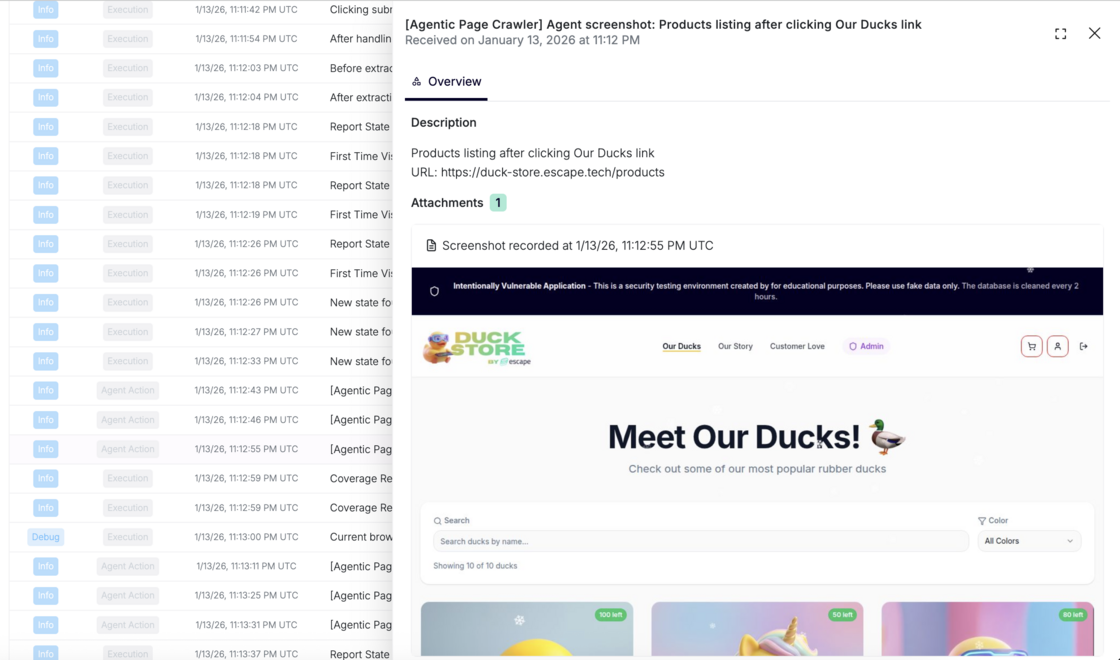
or screenshots captured via Agentic crawling:

Screenshot 2026-01-16 at 17.04.13.png

  • Clear explanation of why an issue was raised

You can even save filtered views to reuse during reviews or audits.

Feel free to explore!

Want to improve your current coverage? Check out our documentation.

#144 · Multi-user authentication fallback

With Escape, you can now configure multiple authentication users and enable fallback mode.

Why this matters

At scale, teams may maintain several test users with identical permissions. All of them are valid on paper, but at scan time:

  • One user may already have an active session
  • Some users may be temporarily disabled or locked
  • A user’s password may have been rotated

In those cases, authenticated DAST scans can fail simply because the selected user wasn’t valid when the scan ran, even though another equivalent user would have worked.

When scans are automated and run unattended, this leads to failed scans, retries, and manual intervention, wasting precious time of already quite stretched security teams.

Escape now takes care of selecting the working user for you.

With fallback enabled, Escape will attempt authentication using each configured user and proceed with the first one that succeeds. The scan then runs normally using that user.

This removes the need to decide in advance which specific user a scan should rely on.

How to set it up

  • Go to a dedicated scan profile

    Create or open the scan profile where you want to enable authenticated scanning.

  • Open Settings → Authentication

    This is where authentication behavior is configured for the scan.

  • Enable multi-user fallback

    Turn on fallback mode by setting: multi_user_is_fallback: true

  • Configure multiple users using a Browser Agent preset

In your Browser Agent authentication preset, define all users that can be used interchangeably for the scan.

Here is a full setup example:

presets:
  - type: browser_agent
    users:
      - password: user1
        username: user1@test.com
      - password: user2
        username: user2@test.com
      - password: user3
        username: user3@test.com
      - password: user4
        username: user4@test.com
    login_url: https://example.com/login
    auto_extraction_urls: []
    logged_in_detector_text: Login successful
multi_user_is_fallback: true

If only user3@test.com is active and valid, Escape will attempt authentication with user1@test.com (fails), then user2@test.com (fails), and finally user3@test.com (succeeds). The scan will then proceed using user3@test.com credentials.

Important limitation

Multi-user fallback cannot be used with tenant isolation testing.

Fallback mode runs the scan using a single authenticated user. If you need to test access boundaries between users, run separate scans per user and disable fallback.


This feature is designed to improve reliability of your DAST scans.

Use it when:

  • You have multiple users with the same role
  • Authentication failures occasionally block scans
  • Scans run automatically (CI/CD, scheduled scans)
  • You want scans to complete without manual retries

For more information on enabling fallback mode for multiple users, please refer to our documentation.
#142 · Improved Identification of Escape DAST Traffic

Escape DAST now makes it simpler to identify and securely whitelist scan traffic in your WAF.

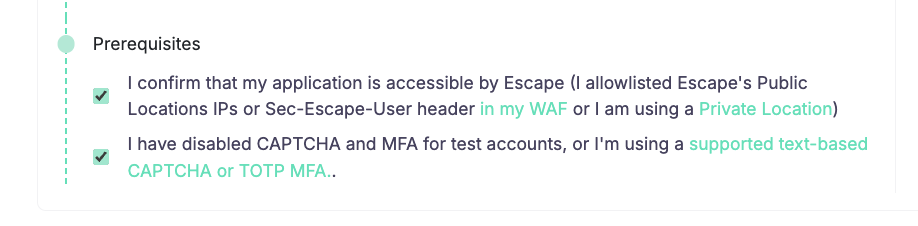
To ensure your application remains accessible to Escape scans, you now have three supported options:

Screenshot 2025-12-24 at 14.05.31.png

  1. Whitelist Escape Public Locations IPs

  2. Use a Private Location

    → Private Location documentation

  3. Whitelist the Sec-Escape-User header in your WAF

    → Firewall configuration documentation

Sec-Escape-User Header for Secure WAF Whitelisting

As mentioned, all HTTP traffic generated by Escape DAST now automatically includes the Sec-Escape-User header.

This header identifies the Escape user who initiated the scan, making it easier to recognize legitimate DAST traffic in logs and WAF rules.

To configure custom HTTP headers and include a shared secret following the example configuration below:

network:
  sec_escape_user: true
custom_headers:
  X-MyCustomHeader:
    - secret123

Full documentation is available here.

For backward compatibility:

  • The x-escape-user header is still sent in API traffic and iin Web App DAST only if it was previously enabled

More details are available in the DAST configuration documentation.
⚠️ Security reminder: This can be used to identify HTTP traffic coming from Escape, but make sure to also verify the IP as headers can easily be spoofed by anyone!

With this new configuration:

  • Escape continues to send the default Sec-Escape-User header.
  • A custom header with a secret value is added to every DAST request.
  • Your WAF can allow traffic only when both the trusted IP range and secret header are present.

Why it matters

  • Fewer blocked scans in WAF-protected environments
  • Stronger verification of legitimate DAST traffic
  • Simple, flexible setup without weakening security controls

This update gives security teams greater control and confidence when running Escape DAST against production-like environments.