#150 · New: Attack Path Validation & Observable API Coverage in Escape
As with web applications, we reworked how Escape represents dynamic security testing coverage across APIs to give you full transparency into the scanner input, so you can confidently verify results and avoid blind spots.
What’s New For APIs (At a Glance)
- New Coverage page showing all API endpoints actually visited during a scan
- Advanced filtering by endpoint, severity, method / mutation type, and coverage status
- HTTP status code visualization to quickly spot error-heavy or unreachable routes
- Attack Path Validation graph that gives you visibility into Escape’s API exploration engine and helps you ensure that everything found by Escape is interpreted in the correct way and that all the input is valid.
- Pentesting Summary (Beta) explaining endpoint's purpose and what vulnerabilities found on that endpoint
- New Logs page with a full, filterable execution trace of the scan
Yes, you can now get full visibility into everything executed during a scan and truly check whether Escape is testing your APIs appropriately. You can find more details on each point below.
Why this matters
After every security scan, you might be left wondering: "Did it actually test our admin endpoints? How did it reach that nested API call? Why didn't it find the vulnerability our pentester discovered?" When auditors, developers, or leadership ask for proof of thorough testing, you're stuck with a vulnerability report and a shrug.
Now, we help your team to answer the following questions:
- What endpoints were actually tested?
- How were inputs discovered? Were they discovered well? How were they chained?
- Did authentication succeed, and where did it fail?
- Which attack paths succeeded, failed, or were blocked?
This update makes Escape’s exploration and testing fully transparent, end-to-end. You can prove what was tested, troubleshoot gaps instantly, and stop defending your security tooling.
What's New In Details - For API Testing
Coverage Page: Proving What Was Actually Tested
The Coverage page shows every API endpoint visited by the crawler, allowing you to quickly confirm that sensitive routes were actually exercised.
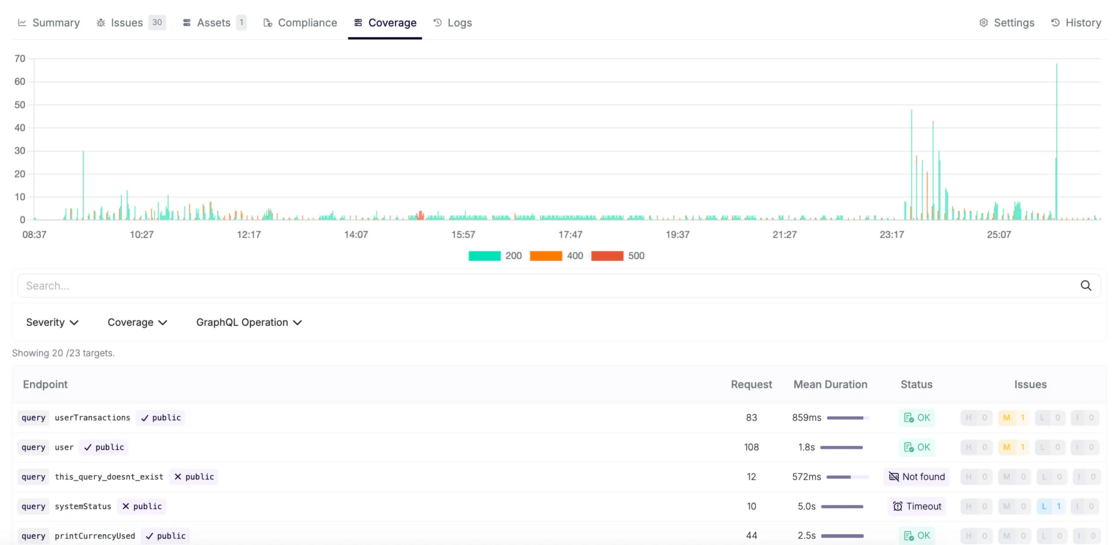
You can:
- Search for a specific endpoint or resolver
- Confirm whether it was tested
- Immediately see if testing succeeded, partially failed, or was blocked
This lets you answer, with certainty:
Was this endpoint actually exercised during the scan?
You can narrow the list of endpoints by:
-
Associated vulnerability severity
→ focus on endpoints involved in high-impact findings
-
Associated HTTP method (REST) or mutation type (GraphQL)
→ understand how an endpoint was interacted with
-
Coverage status
→ OK, server error, timeout, unreachable, etc.
This is especially useful to:
- Identify endpoints that consistently error out
- Spot routes that were reachable but never returned valid responses
- Understand where configuration issues prevented deeper testing
At the top of the page, Escape visualizes HTTP status codes (200 / 400 / 500 …) in a stacked bar chart. This gives you a fast signal for question like “Are a large number of endpoints returning 400 or 500?”
Attack Path Validation Graphs: Verify that interpreted in the correct way
Coverage page tells you what was reached. Attack Path Validation Graphs show how it was reached, including the initial input. For each endpoint, you can open an Attack Path Validation Graph that exposes the exact execution chain used by Escape to get there.
These graphs help you to understand complete request sequence generated by Escape’s Business Logic Security Testing (BLST) algorithm, an intelligent engine built by the our research team that understands dependencies, extracts dynamic values, and chains requests like an experienced pentester.
What the Graph Shows (Precisely)
Each graph represents:
- The sequence of requests and responses
- Dependencies between endpoints
- Data extraction and reinjection logic used to build valid requests
Extractions and reinjections between different requests are described using jq syntax.
Example (REST API): Chaining Endpoints the Way an Attacker Would
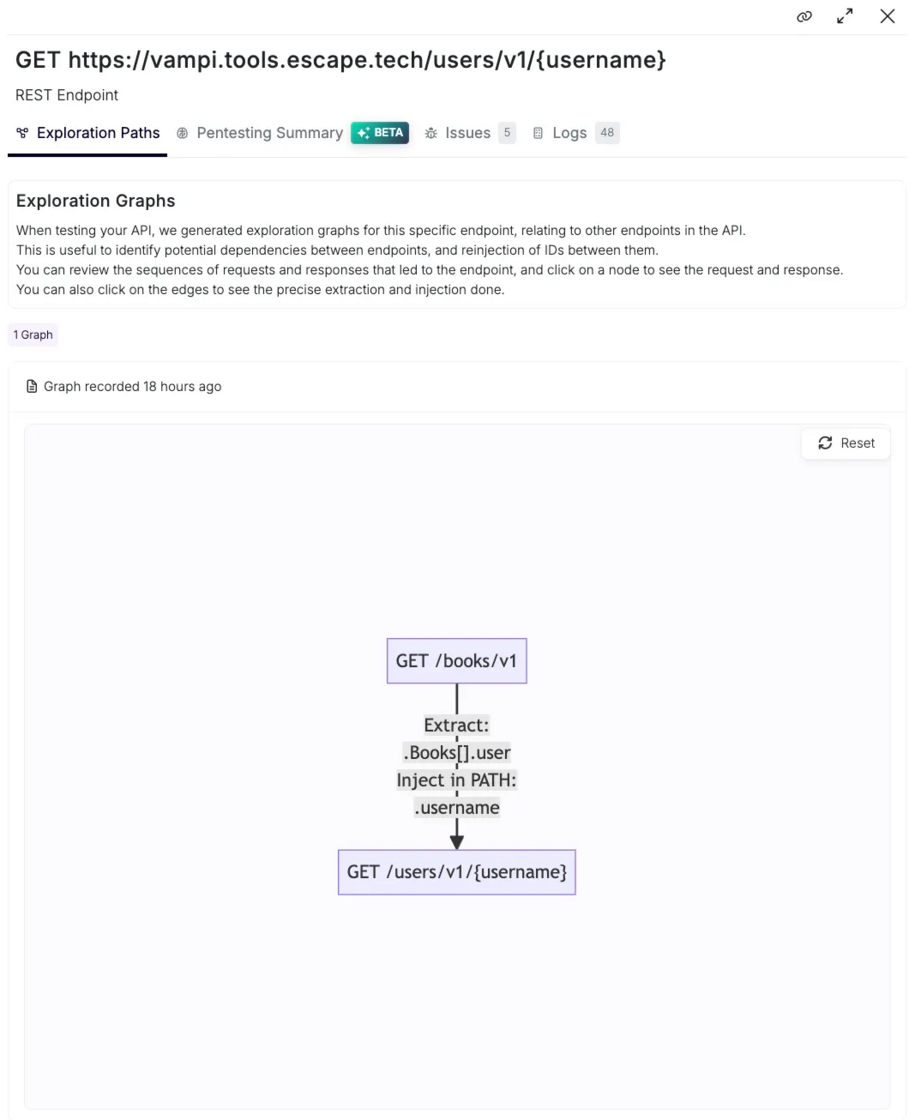
Imagine an API exposing:
-
GET /books/v1→ returns a list of books and associated
user_id -
GET /users/v1/{user_id}→ returns user details
During exploration:
- Escape calls
GET /books/v1 - Extracts
user_idvalues from the response - Reinserts those IDs into
GET /users/v1/{user_id}
In the Attack Path Validation Graph, you can see:
- Where the ID came from
- How it was validated
- Which follow-up requests succeeded or failed
Pentesting Summary (Beta)
To complement raw execution data, Escape adds AI-generated summaries per endpoint.
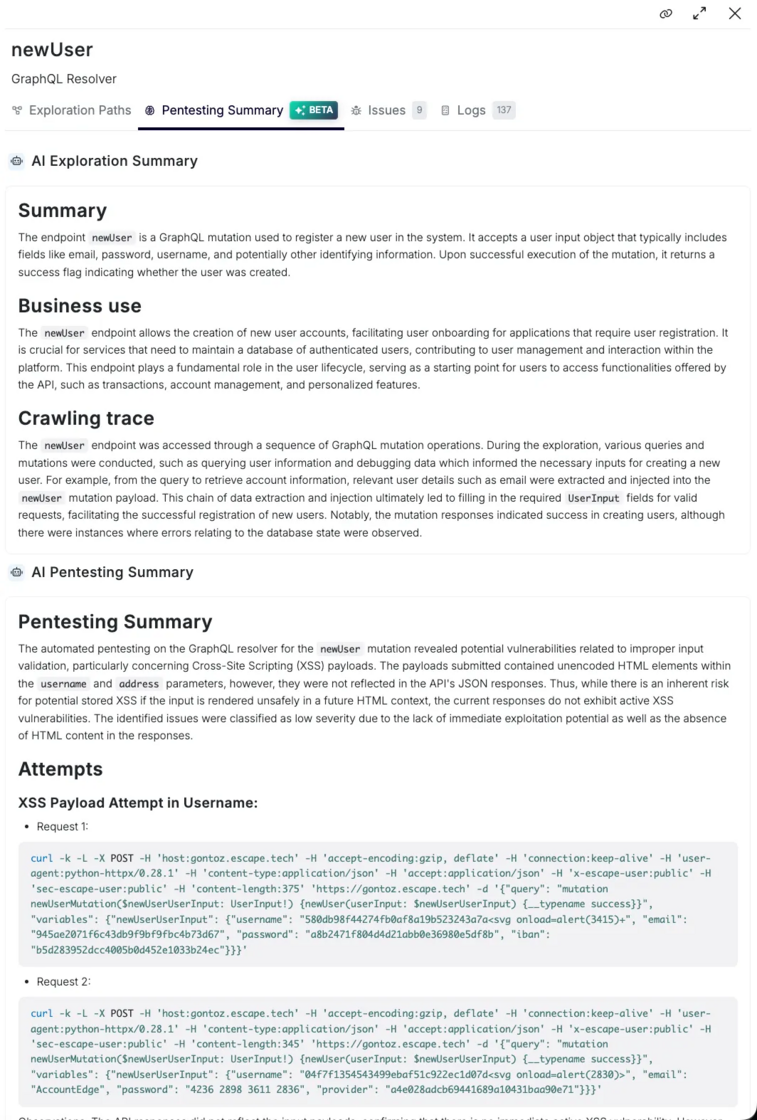
Exploration Summary (Beta)
This explains endpoint's purpose, business logic, how it was discovered, and which execution path led to it
Useful for:
- Reviews
- Knowledge transfer
- Audits
Pentesting Summary (Beta)
This section focuses on security impact and provides explanations:
- What vulnerabilities were found
- Which payloads triggered them
- Why the behavior is exploitable
- What an attacker could realistically do
It connects findings directly to execution evidence.
To get access to the AI pentesting summary feature, reach out to your dedicated Escape contact.
As with Web Apps, whether you’re validating a critical admin endpoint, debugging a failed scan, preparing for an audit, or reviewing a production incident, Escape gives you the right evidence.