Skip to content

Platform

#60 · New updates to Escape's Public API

We’re excited to announce two powerful updates to Escape's Public API, designed to enhance your workflow and make application management even more efficient:

  1. Search Endpoint /organization/{id}/applications/search​: Effortlessly locate and filter your applications with this new endpoint. Save time and streamline your workflows by quickly accessing the information you need.
  2. Scheduling via /create-application:

  3. Custom Scanning Schedules: Use cron in the request body to specify the exact frequency of your scans.

  4. Disable Scheduling: Flexibly manage scans by disabling the schedule through disable scheduling in the same endpoint.

Getting started

Ready to explore these new features? Check out the documentation for details:

🔗 Search Applications Endpoint

🔗 Scheduling Features

#58 · Improved Pagination - Compliance page

We’re thrilled to announce the addition of pagination to the Compliance page, designed to enhance usability, improve performance, and ensure a more efficient navigation experience for users dealing with large datasets.

Pages Affected

Compliance Page: Navigate and manage compliance records more efficiently, regardless of the dataset size.

What’s New?

  1. Enhanced Pagination Structure: A re-engineered pagination system ensures smoother transitions between pages and reduces load times, especially for extensive datasets.
  2. Optimized Page Loading: Improved backend logic significantly accelerates data retrieval and rendering.

#57 · Improved Pagination

We’re excited to announce an update to pagination across key areas of our platform! This improvement is designed to deliver faster loading times and a more seamless experience when navigating large datasets.

What’s New?

  1. Enhanced Pagination Structure: A re-engineered pagination system ensures smoother transitions between pages and reduces load times, especially for extensive datasets.
  2. Optimized Page Loading: Improved backend logic significantly accelerates data retrieval and rendering.

Pages Affected

  • Inventory - All Services & Schemas: Quickly access and scroll through large inventories with reduced delays.
  • Security Scan - Tested Applications: Enjoy a smoother experience when browsing through your tested application records.
  • All Risks - Issues: View and manage your issues more efficiently, even with high volumes of data.

#56 · Jira Integration - Send Remediation Info to Your Developers

Bridging the gap between security and development has never been easier. Security teams can now automatically share actionable vulnerability information with pre-filled remediation steps, saving time and ensuring faster resolution. No more back-and-forth—your developers can hit the ground running with the fix already in hand.

Getting started

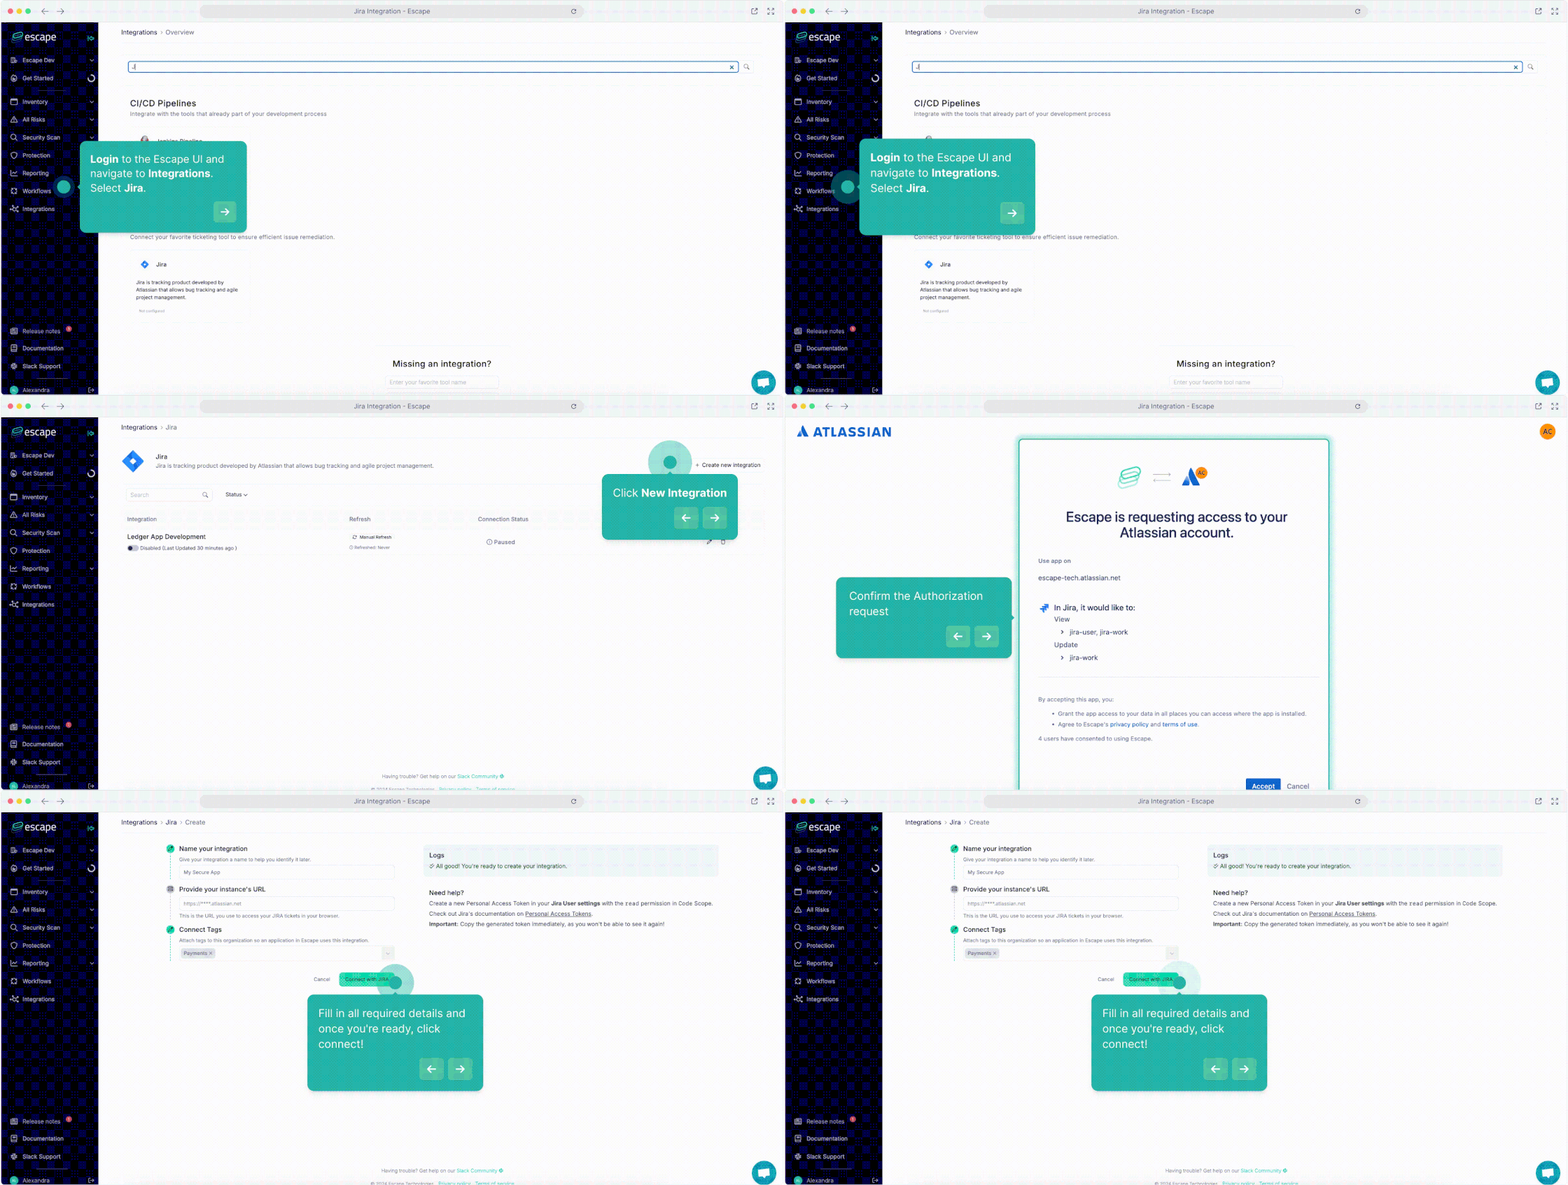
  1. Login to the Escape UI and navigate to Integrations.
  2. Select Jira.
  3. Click New Integration and confirm the Authorization request.
  4. Give your integration a name for easy identification.
  5. Enter your Jira instance URL (e.g., https://escape.atlassian.net/).
  6. Attach relevant Tags to ensure proper linkage with applications in Escape.

2024-09-19-Jira_Integration___Escape.gif

You can create as many integrations as you wish for each application label.

How to Create a New Jira Ticket:

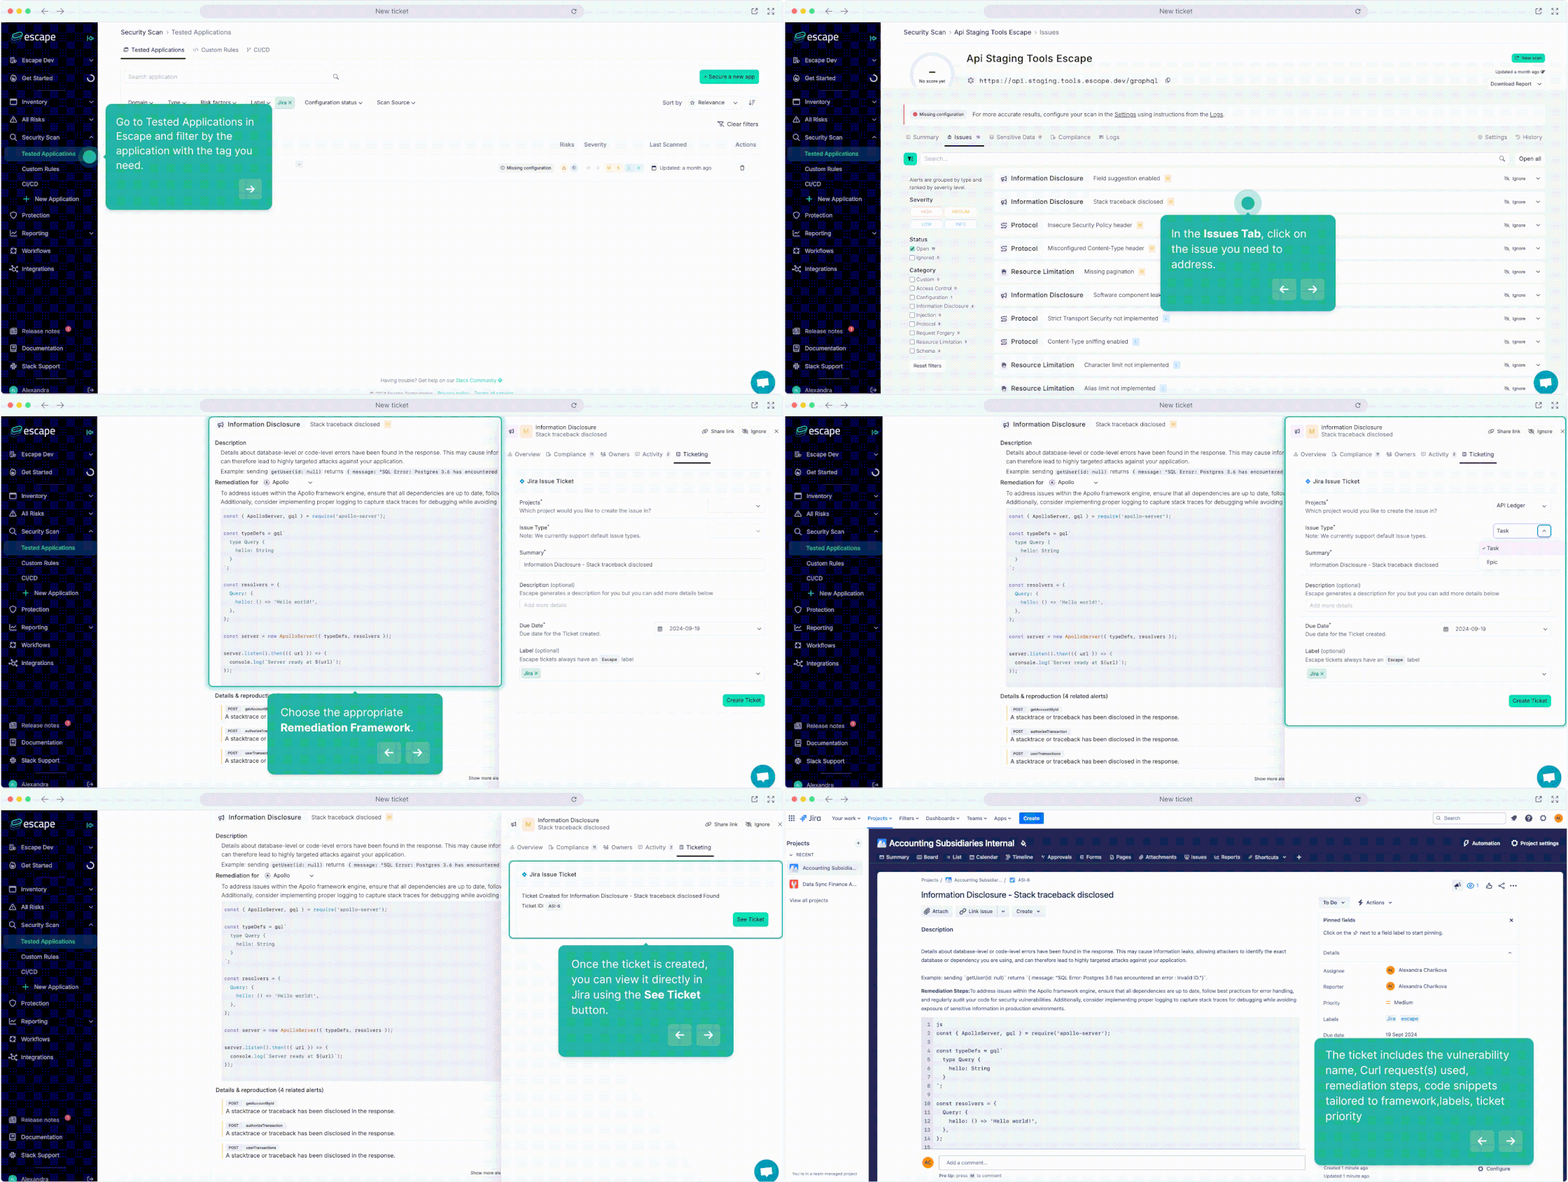
  1. Go to Tested Applications in Escape.
  2. Select the application with the relevant vulnerability.
  3. In the Issues Tab, click on the issue you need to address.
  4. Choose the appropriate Remediation Framework.
  5. Click More, then go to the Ticketing Tab.
  6. Select the Project and Issue Type (Task or Asset).
  7. Add additional information to the auto-generated Summary. & Description (if necessary)
  8. Set a Due Date
  9. Click on Create Ticket. and that's it!

2024-09-19-New_ticket.gif

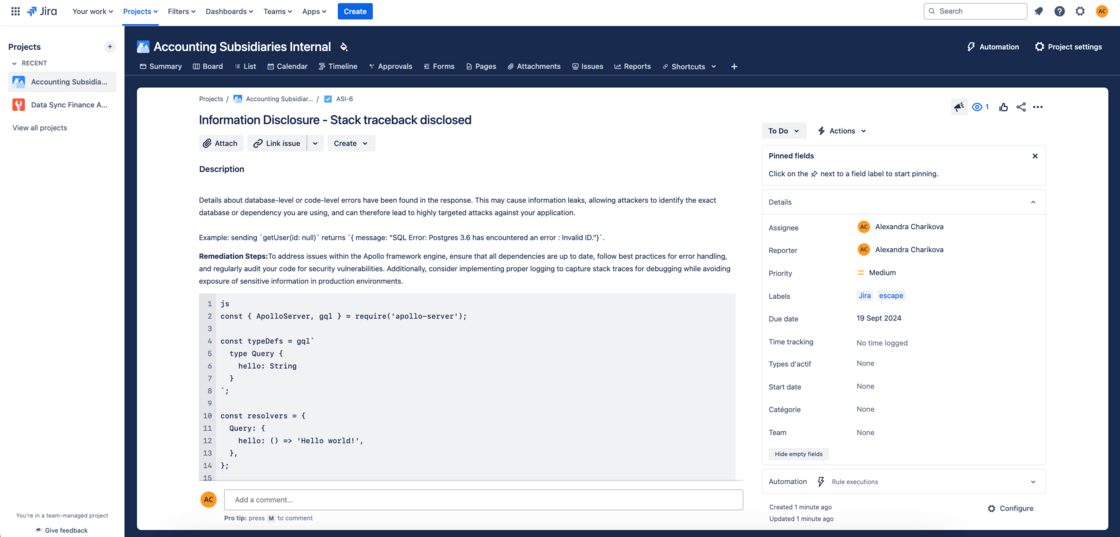
Once the ticket is created, you can view it directly in Jira using the See Ticket button. The ticket includes:

  • Vulnerability name (e.g., Broken Object Level Authorization (BOLA)).
  • Curl Request(s) used
  • Remediation steps
  • Relevant code snippets tailored to framework
  • Associated application labels
  • Adjustable ticket priority

Escape Ticket on Jira side.png

With this new integration, you should be able to accelerate your remediation process and keep your developers focused on what matters most—delivering secure applications faster.

#55 · [Expert users] Persisted GraphQL Query Support

You can now test the security of Persisted GraphQL Queries with Escape's API security platform. This new capability enhances our GraphQL API security testing, offering deeper insights into vulnerabilities specific to persisted queries, allowing your team to protect APIs from targeted attacks better.

We support the following formats:

  • Apollo
  • Yoga
  • Custom implementations

Why

  • Optimized Testing for Persisted Queries: Persisted queries are often used for performance and security optimization in GraphQL, but they can introduce unique vulnerabilities if not properly secured. With our new feature, you can now detect security flaws in these pre-saved queries.
  • Prevention of API Misuse: Attackers can exploit persisted queries to bypass query validation and inject malicious content. Escape ensures that your queries are thoroughly tested for such risks.
  • Enhanced Coverage for GraphQL APIs: Persisted queries are a common practice in modern applications. This feature ensures that your GraphQL API testing is comprehensive, covering both dynamic and persisted queries.
  • Seamless Integration with Your CI/CD Pipeline: As with other Escape features, testing persisted GraphQL queries integrates smoothly into your existing CI/CD workflows, keeping security at the forefront of your development process.

Getting started

  1. Go to the Security Scan tab, click on Tested applications, and select the application you want to test.
  2. Once you're on the scan result page, click on Settings and select Expert mode
  3. Configure your YAML file by adding the .json file for your persisted queries:

graphql_persisted_queries_url: https://example.com/persisted_queries_manifest.json

  1. Save the changes and restart the scan.

And that's it!

With these new updates, you should be able to tackle even the most advanced API risks with confidence. `

#54 · New notificaton rules for scans

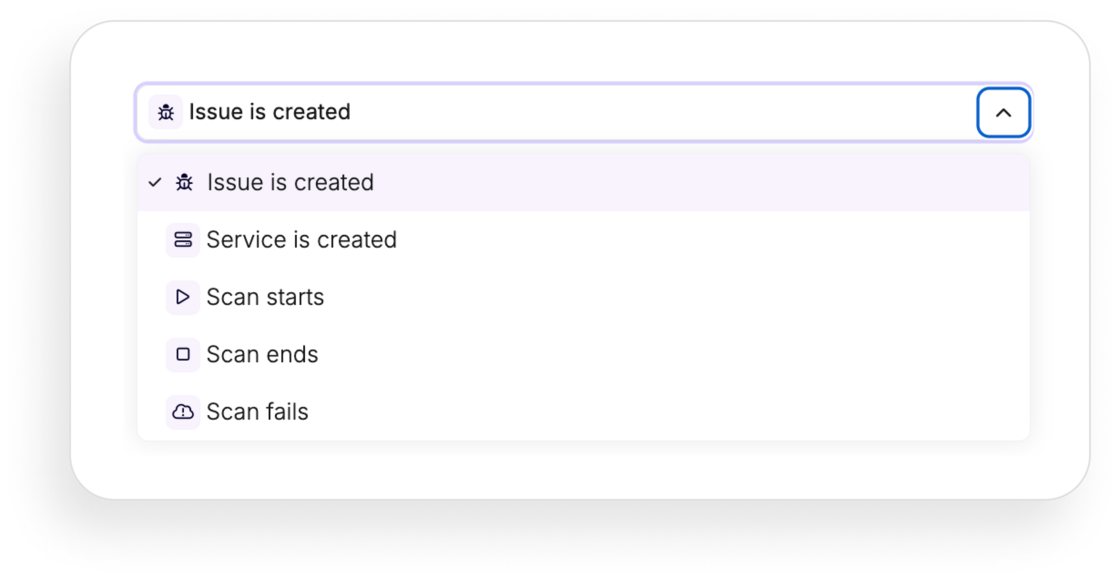
We're excited to introduce three new event triggers that enhance your notification rules, giving you greater control and visibility over your scan processes. You can now get notified when a scan starts, ends, or fails—right when it matters most.

You can now receive notifications for the following events:

  • Scan Starts: Trigger a workflow as soon as a scan begins.
  • Scan Ends: Get alerted when a scan completes.
  • Scan Fails: Be notified immediately if a scan fails.

These triggers allow you to filter notifications based on specific scan labels or relevant applications, ensuring you only receive the alerts that matter to you.

expanded-workflows.png

Why

Stay on top of your scanning activities and respond quickly to important events. Whether it's a successful completion or a failure that needs immediate attention, these notifications ensure you're always in the loop.

Getting started

  1. In the left-hand sidebar, click Notifications.
  2. Click Create a new rule
  3. Choose when your workflow should be triggered:

  4. When a new vulnerability has appeared in your application(s)

  5. When a new APi service is created
  6. When a scan starts
  7. When a scan ends
  8. When a scan fails

  9. Specify the conditions for your workflow. You can filter by scan label or application to refine your notifications.

  10. Select among actions that you want your rule to perform:

  11. Send an email to specific people

  12. Send an email to a group of people
  13. Send an email to all related owners
  14. Send a Slack message
  15. Send a Discord message
  16. Send a Teams message
  17. Send a Webhook

  18. Schedule how often the action should run

  19. Name your rule and click on Create rule to save your workflow

And that's it! You can create as many notifications as your organization needs.

#53 · New way to prioritize issues: Focusing on Escape Severity

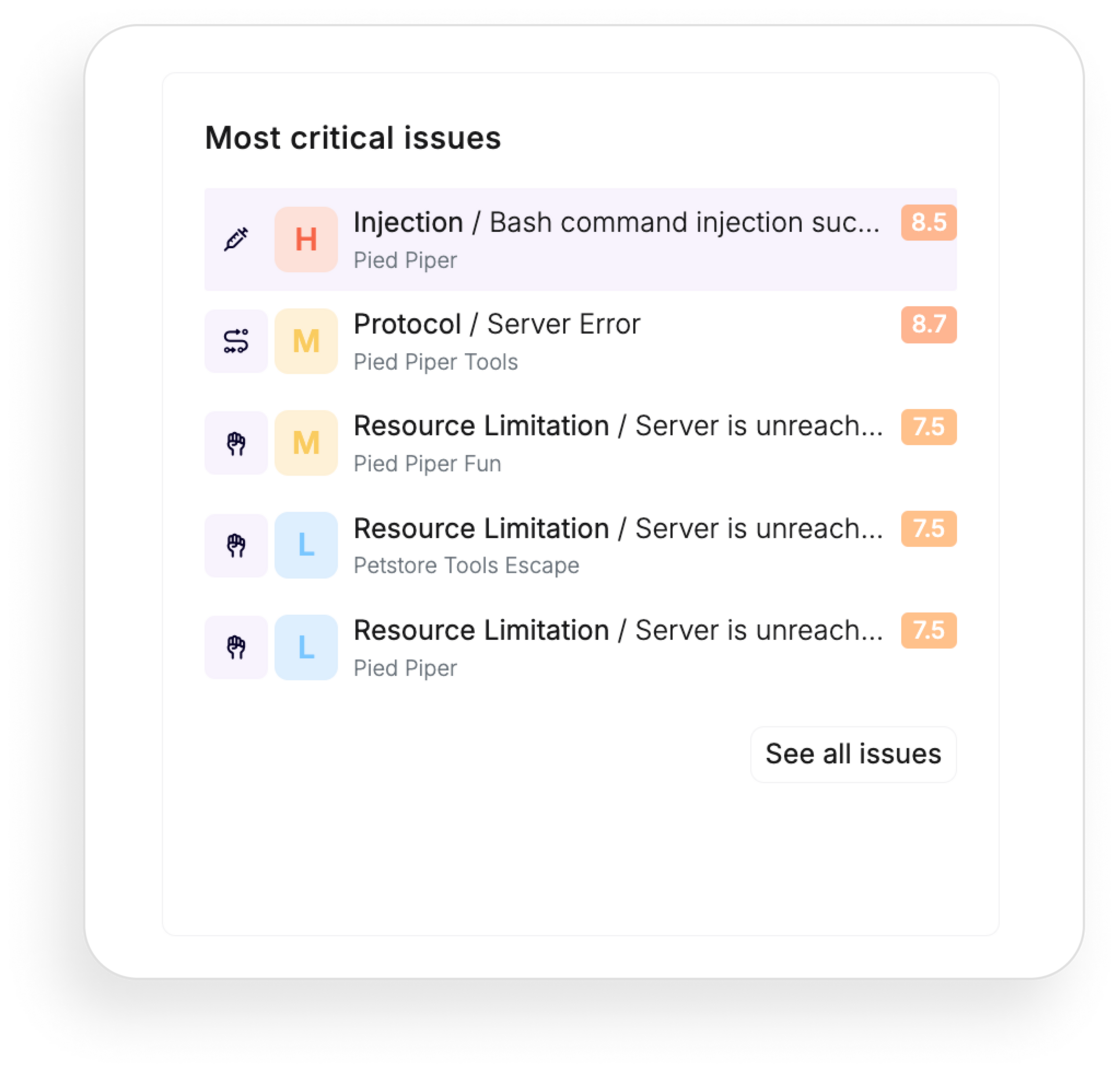
In your Reporting dashboard, you’ll notice an update in how we categorize critical issues. We’re moving away from the traditional CVSS score-based system and adopting a new approach that highlights Escape Severity, including context related to API services.

most-critical-issues-order.png

Why

We’re making this change to give you a more accurate, contextual, and actionable assessment of vulnerabilities. While CVSS scores provide a numerical risk measure, they don’t always capture the full picture. Escape Severity considers various factors such as the type of vulnerability, its exploitability, CVSS score, and other risk factors.

This comprehensive approach helps us better align issue prioritization with real-world risks and ensures you tackle the most critical issues more effectively.

Getting Started

To see this in action, go to the Reporting tab and select Overview.

You’ll now find that the most critical issues are arranged by Escape Severity!

#52 · Introducing "Software" in inventory: Differentiate self-hosted third-party services

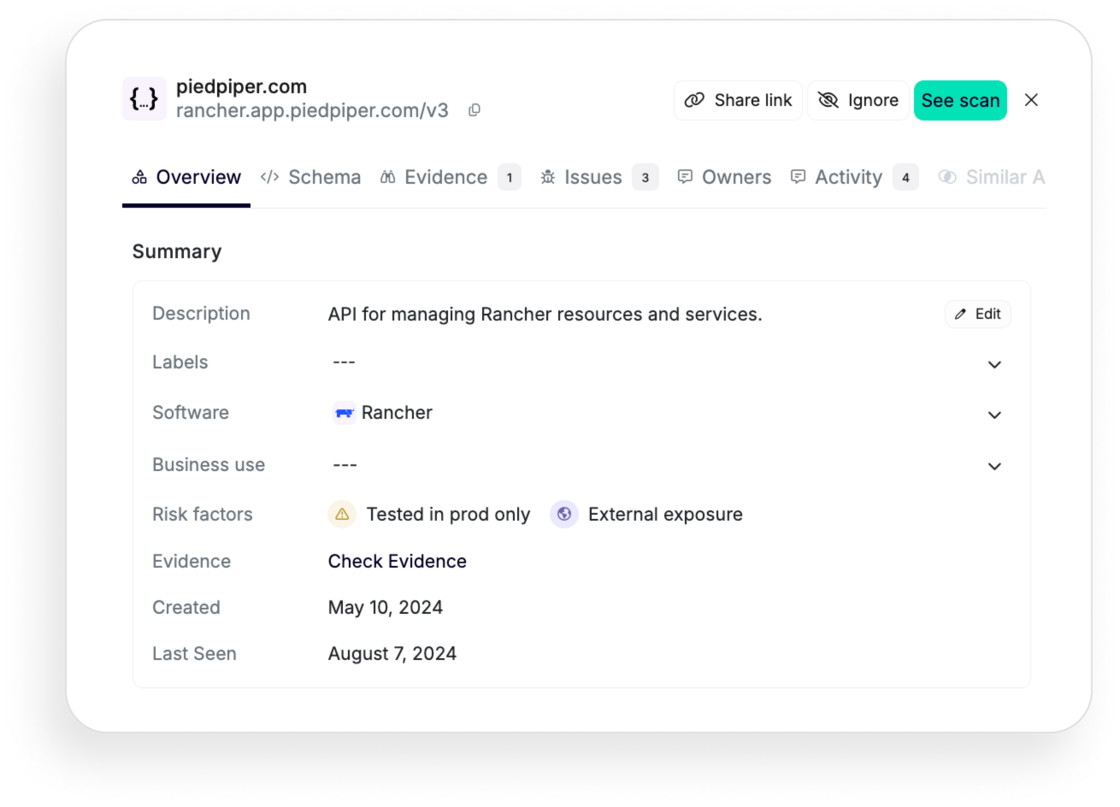
In each API service, you can now view the "Software" line, which helps you answer the question, "What are my self-hosted third-party services?" This enhancement marks the beginning of our journey towards supporting third-party services within the Escape platform.

Why

The inclusion of "Software" in our API inventory addresses a critical need: the ability to differentiate between first-party and third-party APIs. This distinction is crucial for various operational and security processes.

For instance, you can now choose to disable security scans on these self-hosted third-party services, focusing on what's most relevant to your unique setups.

Getting started

To get started, navigate to your API inventory and select a particular API service. You'll be able to view the associated software, such as this example API service for managing Rancher resources:

rancher-app-example.png

Some examples of software that can be listed include popular tools and platforms like:

  • MongoDB
  • PostgreSQL
  • Ghost
  • MySQL
  • Rancher
  • Portainer
  • Gluu Server
  • LemonLDAP
  • WireGuard
  • OpenVPN
  • ownCloud

…and many more.

Additionally, when you export your API inventory in CSV format, you'll be able to visualize all your associated self-hosted third-party services under the wellKnownService column, enabling simplified analysis. Give it a try!

#51 · Export your scan & all issues reports in CSV

You can now export your scan and issues reports in CSV format. This update includes the ability to export the following tables:

  • Inventory (available previously)
  • All Issues
  • Scan Report for a Particular App

Why?

Exporting reports in CSV format offers several significant benefits:

  • Ease of Analysis: CSV files can be easily opened and analyzed using various tools like Excel, Google Sheets, and data analysis software.
  • Custom Reporting: Create custom reports by filtering, sorting, and manipulating the data according to your needs.
  • Enhanced Accessibility: Share and collaborate with team members more effectively by distributing CSV files.

Getting Started

Here's a detailed look at what you can export and how you can use these CSV reports:

All Issues

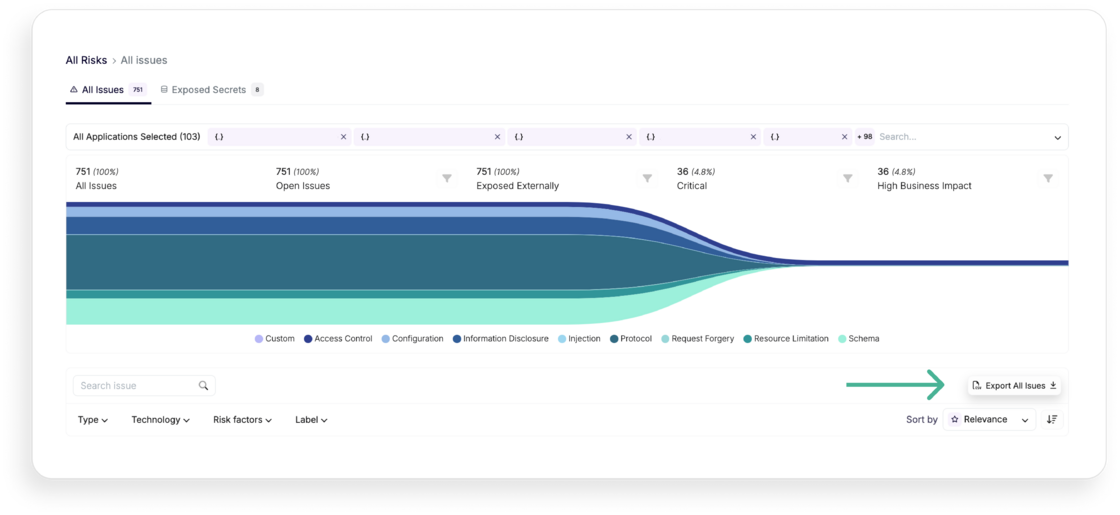
First, navigate to the All Risks tab, then click on "Export All issues". And that's it!

export-all-issues.png

The "All Issues" export allows you to view detailed information about every issue identified across your assets. The exported CSV will include the following columns:

  • FailureName: The name of the issue. For example, Enumeration (BOLA/IDOR) detected.
  • AlertDescription: A description of the alert. For example, "We performed a successful BOLA attack on the petId argument."
  • IssueId: The unique identifier for the issue.
  • Category: The category of the issue. For example, ACCESS_CONTROL.
  • Severity: The severity level of the issue, according to Escape Severity.
  • AlertLink: A link to the alert.
  • ScanId: The identifier for the scan that found the issue.
  • ScanLink: A link to the scan details.
  • Endpoint: The endpoint where the issue was found.
  • EndpointType: The type of endpoint (REST, GraphQL…).
  • FirstSeen: The first date the issue was seen.
  • LastSeen: The last date the issue was seen.
  • Remediation: Suggested remediation steps.
  • Ignored: Whether the issue is marked as ignored.
  • Cvss_score: The CVSS score indicating the severity of the vulnerability.

Scan Report for a Particular App

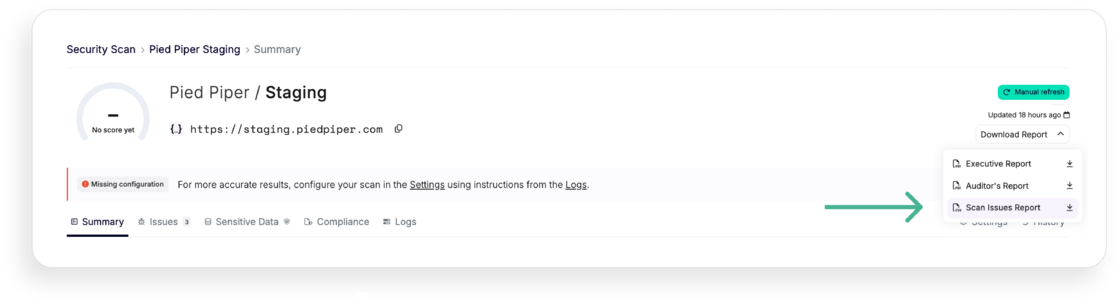
First, navigate to the can that you want to export, then click on "Download Report". Pick .csv file and that's it!

scan-csv-report.png

For a detailed scan report of a particular app, you can export data including:

  • AlertDescription: A description of the alert.
  • IssueId: The unique identifier for the issue.
  • Category: The category of the issue.
  • Severity: The severity level of the issue.
  • AlertLink: A link to the alert.
  • ScanLink: A link to the scan details.
  • Endpoint: The endpoint where the issue was found.
  • EndpointType: The type of endpoint (REST, GraphQL…).
  • FirstSeen: The first date the issue was seen.
  • LastSeen: The last date the issue was seen.
  • Remediation: Suggested remediation steps.
  • Ignored: Whether the issue is marked as ignored.

With these new export capabilities, you can streamline your workflow, enhance your reporting, and ensure that you have all the necessary data at your fingertips.

Understand what's most important for you and make informed decisions with ease.

#50 · Customize your compliance view

We are excited to announce a new feature designed to enhance your compliance management experience. It allows you to hide irrelevant compliance frameworks from your compliance matrix, tailoring it to your organization's specific needs.

Why?

Managing compliance can be overwhelming. You might often face an array of frameworks, many of which may not apply to your specific business operations. By enabling you to deactivate non-relevant compliance frameworks, Escape ensures that you can concentrate on the requirements that truly matter, making your compliance efforts more focused and efficient.

Getting started

Ready to tailor your compliance matrix? Follow these simple steps:

  1. Go to Your Organization Page: Simply click on your organization's name in the left-side bar.
  2. Select Compliance: Click on the "Compliance" tab to access your compliance settings.
  3. Deactivate Irrelevant Frameworks: In the compliance settings, you will see a list of compliance frameworks. Simply deactivate the ones that do not matter for your business.

And that's it! We're here to help you focus on what matters.