Skip to content

Platform

#98 · Enhanced Remediation Framework Selection for Frontend Scanner

We’ve enhanced the remediation process in our front-end scanner to help your teams close critical issues faster.

Previously, the framework for generating remediation code snippets was set by default. Now, users have the ability to select their preferred API framework when addressing API-related vulnerabilities, providing more flexibility and control over the remediation of issues.

This update gives you the flexibility to choose the framework that works best for you, making it easier and faster to resolve issues!

#97 · New Design for All Risks -> Issues Table

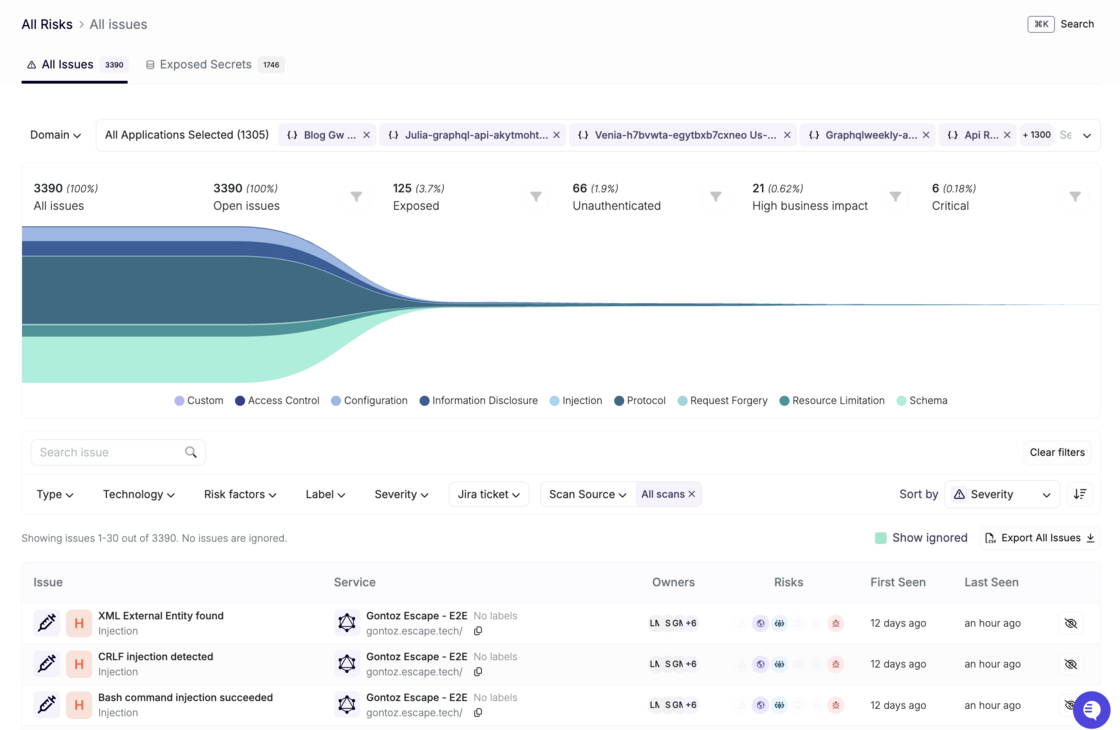
We’ve made several improvements to enhance the user experience with the All Risks -> Issues table. Here’s a breakdown of the new features:

  • Enhanced Application Selection: Users can now select applications either by label or individually, providing more flexibility in managing and viewing the issues per application type important for your business.
  • Jira Ticket Filter: We’ve added a filter for Jira tickets, allowing you to quickly and easily search and categorize issues linked to specific Jira tasks.
  • Sorting by Severity: The issues are sorted by default by severity, ensuring that the most critical issues are always prioritized and easily accessible.
  • Updated Funnel Stages: The stages for “High Business Impact” and “Critical” have been inverted in the funnel. Critical is now the most important stage, highlighting the highest priority issues.

Here is how your Issues Table will look now:

Screenshot 2025-03-25 at 16.49.36.png

We hope these updates help make navigating through issues faster and more efficient!

#94 · Long Scan Stability Improvement

Stability for extended scans has been significantly improved: We've resolved an issue caused by a Python bug that randomly interrupted and killed long scans. We’re confident this fix will ensure a smoother experience with Escape!

#92 · Added Graph Visualization in the Inventory

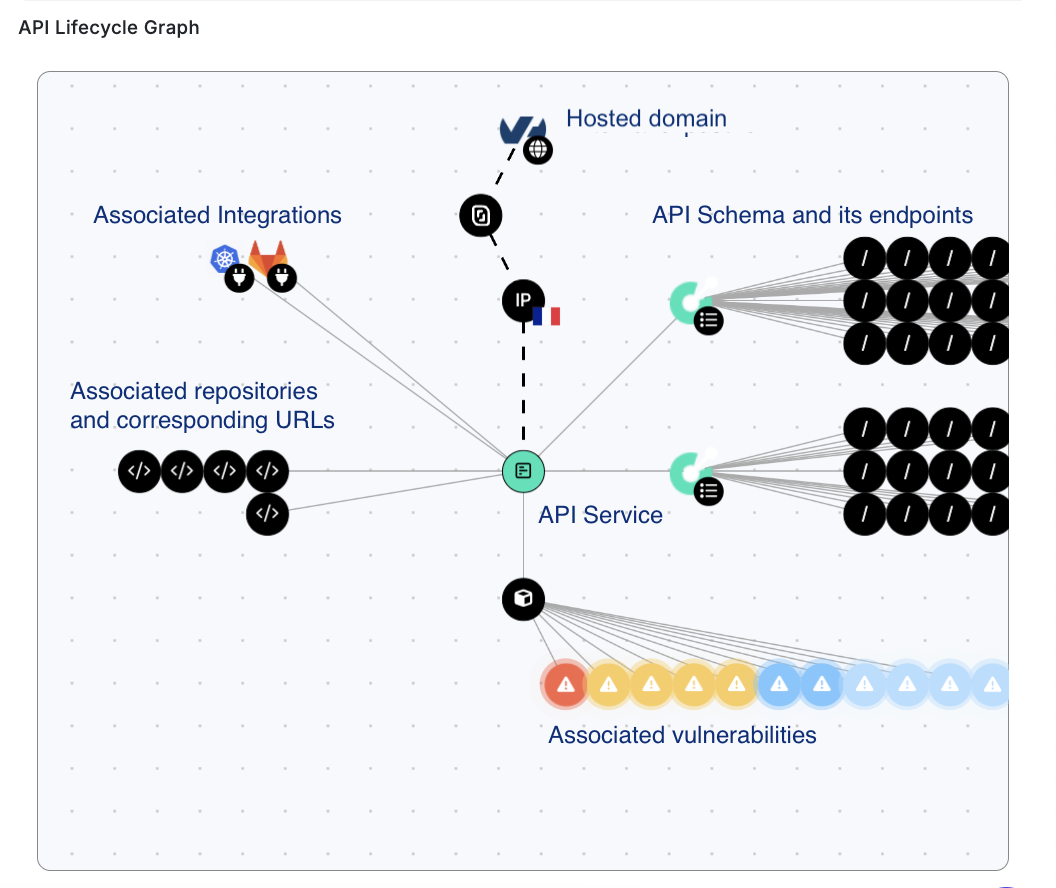
We’ve added a powerful new feature: the API Lifecycle Graph within the Inventory. This visualization allows you to see an in-depth view of your API service, including its lifecycle and key integration details.

api-lifecycle-graph.png

What you can view:

  • API Lifecycle Graph: View the full lifecycle of the API service.
  • Hosting Details: Know the domain where the API service is hosted, the cloud provider, the associated IP address, and the country where it’s hosted.
  • Service Integration: See the integration with Wiz, GitHub, GitLab, Kubernetes or others and how it was set up (e.g., via GitLab API key).
  • Repository Info: Identify the repository and associated URL where the service is hosted.
  • API Schema: View the associated API schema, how it was generated or found, and its endpoints with the methods linked to each endpoint.
  • Application Scan: See which application scan is associated with the service and view alerts linked to that application. Each alert is color-coded depending on its severity.

How to view:

  • Go to Inventory → All Services.
  • Click on the service you want to inspect.
  • You'll find the API Lifecycle Graph at the bottom of the Overview tab.

Benefits:

  • Complete Lifecycle Visibility: The API Lifecycle Graph provides a comprehensive view of your API’s entire journey, from integration to deployment.
  • Simplified Troubleshooting: By visualizing the API's integration and hosting details, you can easily identify potential points of failure or misconfigurations.
  • Better Monitoring and Tracking: Track the service repository, schema, and its endpoints efficiently in one place, making it easier to manage and secure your APIs.
  • Contextual Insights: View associated scans, vulnerabilities, and alerts in context, allowing you to quickly assess the security posture of your API services.

We hope that visually representing all relevant information helps you make informed decisions faster and improves your ability to monitor, manage, and secure your APIs effectively!

#90 · Enhanced "Visited Pages" Tab for Front-End Applications

For each tested front-end application, our "Visited Pages" tab has received an upgrade!

The Visited Pages tab plays a crucial role in your scan results. Unlike API scans, where there is a predefined list of endpoints, front-end scanning relies on a crawling system and security checks engine. This allows you to validate which pages were visited and the issues found on each crawl.
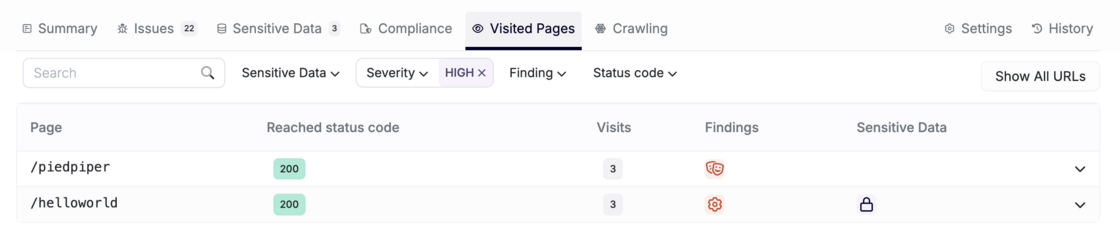
Screenshot 2025-03-07 at 16.41.45.png

What's New:

  • Grouping of Similar Pages: Pages are now grouped by default, helping you focus on key pages and reducing noise for more efficient analysis.

  • Improved Page Organization: Each visited group includes:

    • Page Name
    • Reached Status Code
    • Number of Visits by Scanner
    • Associated Findings (vulnerabilities in the page)
    • Sensitive Data Found
  • Filters: You can filter by:

    • Sensitive Data
    • Severity
    • Associated Vulnerability
    • Type of Finding (Vulnerability)
    • Status Code

If you prefer to see everything, you can still click on Show All for the full view.

This update brings improved efficiency and better organization, allowing you to focus on critical findings and reduce unnecessary noise!
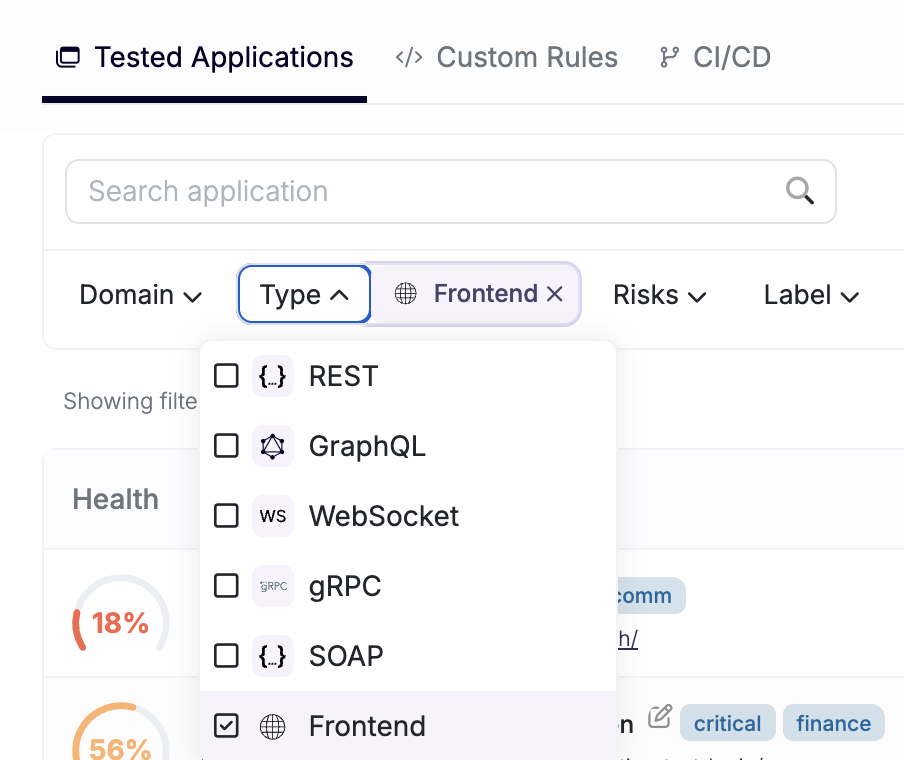
#89 · Added Filter by Front-End in Scanned Applications Tab

We’ve added a new filter to the Scanned Applications tab, allowing you to filter and view scanned front-end applications easily.

Screenshot 2025-03-07 at 16.30.13.png

This makes organizing and accessing relevant applications easier, improving your overall testing workflow!

#88 · Separate Scanning of APIs Associated with Front-Ends for Improved Efficiency

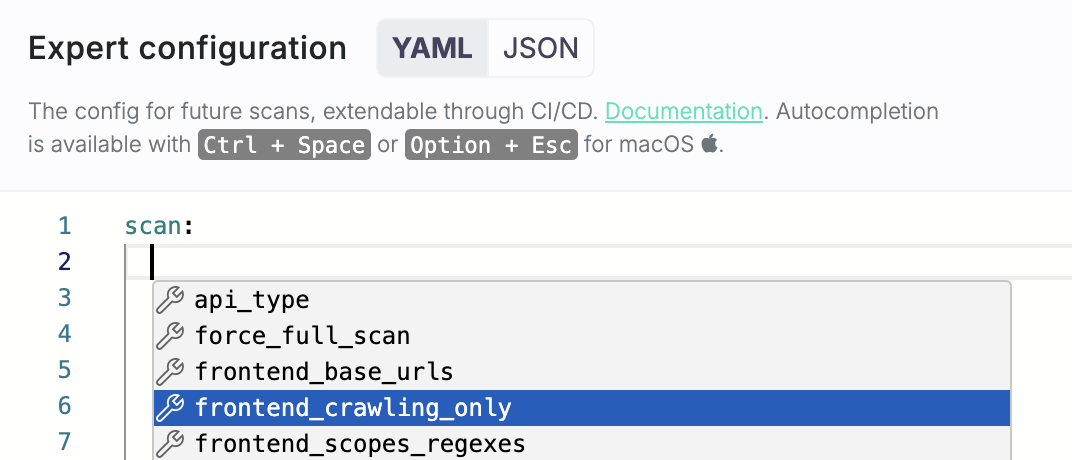
We’ve added a new option to scan APIs associated with the front-end without performing security checks on the front-end itself. If your developers update only the API without touching the front-end, you won’t want to waste time rescanning it. This new feature lets you focus on API vulnerabilities, speeding up the scanning process and avoiding unnecessary checks. To enable this, simply configure the new frontend_crawling_only boolean parameter in your advanced settings.

How to Set It Up

  1. Go to the settings of the relevant app.
  2. Navigate to Scan configuration → Expert.
  3. Under Scan

  4. Either type frontend_crawling_only: true

  5. Or use one of the shortcuts Ctrl + Space (Windows/Linux) or Option + Esc (macOS) and pick frontend_crawling_only from the list.

Screenshot 2025-03-07 at 16.17.33.png

Benefits

  • Focused Scanning: This option helps you focus on scanning APIs without the need to repeatedly check the front-end, making the scanning process more efficient.
  • Improved Efficiency: By skipping the front-end checks, the scan will be faster, allowing you to quickly analyze API behavior without unnecessary extra checks.

#87 · Visualizing Generated API Schema Components

As you know, one of Escape's native capabilities is the ability to generate API schemas for APIs without an associated specification. Escape reconstructs API schemas by parsing the Abstract Syntax Tree (AST) of both frontend and backend source code. Now, we’ve added the ability to visualize the components of the generated schema directly in the Summary tab within the context window for each app.

Screenshot 2025-03-07 at 16.12.17.png

For example, you can now easily see details such as number of GET, POST, PUT, and DELETE methods for REST APIs.

This visualization provides clearer insights into how an API function and whether schema was correctly generated, making it easier for users to spot potential issues and inconsistencies, especially with complex APIs.

For more details on how the generated OpenAPI schema connects to the API service, check out our documentation.