Skip to content

Release Notes

#159 · 04-15-2026 — Public API Release Notes

This release expands the v3 Public API with new endpoints for reporting, issue operations, asset workflows, tags, and ASM automation. It also enriches several existing response schemas with additional metadata to support deeper integrations and better visibility.

Hard-breaking changes

None.

Soft-breaking changes

These changes are additive and backward-compatible for most clients, but may affect consumers using strict schema validation.

  • Asset responses now include owners email addresses.
  • Profile summary responses now include:
    • score
    • coverage
    • openIssueCount
    • lastScanStatus
  • Location summary responses now include:
    • lastSeenAt

Non-breaking changes

New endpoints

  • GET /v3/statistics

    • Returns high-level organization statistics for applications, monitored assets, and issues by severity.
  • GET /v3/issues/funnel

    • Returns issue funnel data to help track issue progression and exposure.
  • GET /v3/issues/trends

    • Returns time-series issue severity trends.
  • POST /v3/issues/bulk-update

    • Bulk update issue status across multiple matching issues.
  • POST /v3/issues/{issueId}/notify

    • Notify asset owners about a specific issue.
  • POST /v3/assets/bulk-update

    • Bulk update assets.
  • POST /v3/assets/bulk-delete

    • Bulk schedule assets for deletion.
  • GET /v3/tags/{tagId}

    • Retrieve a tag by ID.
  • PUT /v3/tags/{tagId}

    • Update a tag.
  • GET /v3/assets/{assetId}/activities

    • List activities for an asset.
  • POST /v3/assets/{assetId}/activities

    • Add a comment/activity to an asset.
  • POST /v3/asm/scans

    • Trigger ASM scans programmatically.

Existing endpoint improvements

  • GET /v3/scans

    • Added support for filtering by assetIds.
  • GET /v3/custom-rules

    • Added support for filtering by context.

Summary

This release is focused on expanding the v3 Public API without introducing hard-breaking changes. It adds new operational and reporting endpoints, improves filtering capabilities, and enriches existing resource payloads with more useful metadata for customer integrations.

#158 · Workflows API OpenAPI v3.1

Breaking changes

Workflows API restructured

The single-workflow endpoints have been replaced with a resource-oriented API. You will need to update any integration that calls the workflows endpoints.

┌───────────────────┬────────────────────────┐ │ Old │ New │ ├───────────────────┼────────────────────────┤ │ GET /workflows │ GET /workflows/{id} │ ├───────────────────┼────────────────────────┤ │ PUT /workflows │ PUT /workflows/{id} │ ├───────────────────┼────────────────────────┤ │ DELETE /workflows │ DELETE /workflows/{id} │ └───────────────────┴────────────────────────┘

A new GET /workflows endpoint now returns a paginated list of all your workflows (instead of a single workflow object).


Non-breaking changes

  • OpenAPI spec upgraded to 3.1 — the spec served at /v3/openapi.json now uses the OpenAPI 3.1 format. Nullable fields are now expressed as type: ["X", "null"] instead of nullable: true. This is semantically equivalent; most client generators handle both.
  • New POST /workflows endpoint added to create workflows programmatically.
  • Automated Pentest GraphQL profile (POST /profiles/ai-pentesting/graphql) — internal stability metadata removed from the spec; no functional change.

#157 · Better asset filtering & bug fixes

We've made significant improvements to how asset sources are handled across the Attack Surface Management module, with better filtering, bug fixes, and a more consistent experience throughout.

What's new

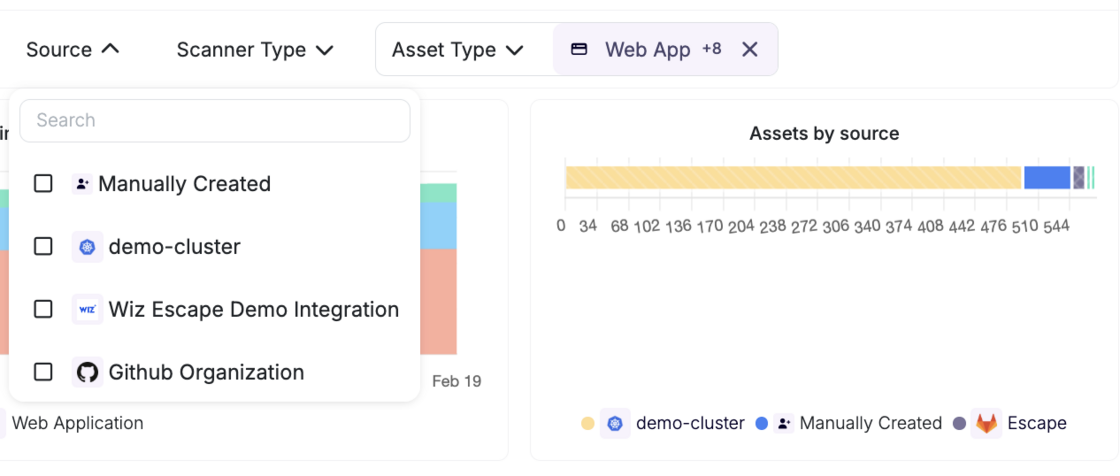
You can now filter assets in tables by their source type — currently Manually created and Integration are supported, with filtering by specific asset source coming soon.

Screenshot 2026-02-20 at 09.37.15.png

Behind the scenes, we've centralized and reworked the sources logic, ensuring that source information is coherent and consistent across all views. This also came with a large number of bug fixes that were causing sources to display incorrectly in certain contexts.

Bug fixes & improvements

Fixed multiple inconsistencies in how sources were displayed across different views Centralized source logic to ensure reliability and consistency going forward Added table filtering by source type (Manual / Integration)

#156 · Private Asset Detection Now Available in Escape ASM

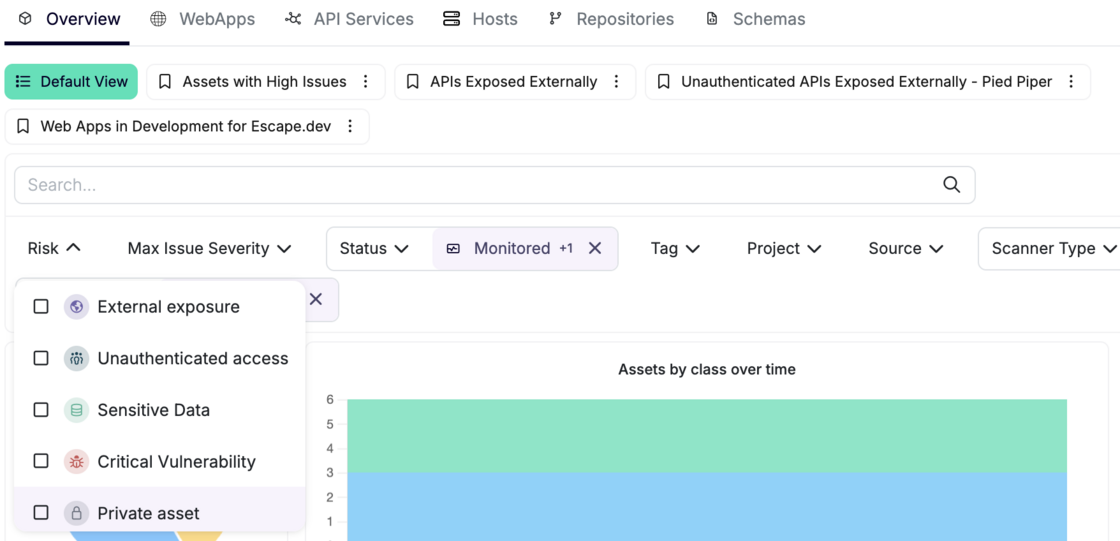
We've expanded our risk detection capabilities to identify private assets across your attack surface — assets whose addresses are not resolvable on the public internet.

Screenshot 2026-02-20 at 09.17.18.png

What's new

When scanning your assets, we now automatically flag any asset whose IP address or domain name resolves to a private or non-routable address. These assets will appear in your ASM dashboard, so your team can review and act on them.

What counts as a private asset

An asset is considered private if its address falls into any of the following categories:

  • Local domains — any .local domain, including Kubernetes services (.svc.cluster.local)
  • Private IP ranges — 10.0.0.0/8, 172.16.0.0/12, and 192.168.0.0/16, as well as their IPv6 equivalents
  • Loopback addresses — localhost, 127.0.0.0/8, and ::1
  • CGNAT range — 100.64.0.0/10

Why it matters

Private assets appearing in your external attack surface can indicate misconfigured services, unintended internal exposure, or infrastructure leaking details about your internal network topology. Identifying them early helps your team prioritize remediation and reduce the risk of internal systems being inadvertently reachable or discoverable.

What to do

Review any private assets flagged in your ASM (Attack Surface Management) dashboard and assess whether their presence is expected. If not, investigate the underlying service configuration and ensure internal resources are not inadvertently exposed.

#155 · Multi-Schema Support for Scan Profiles

APIs built on microservices often have one schema per service. Scanning them together meant merging files manually or accepting gaps in your security coverage.

Now you can attach multiple schemas to a single scan profile. Your full API surface gets tested, without the prep work.

What's new

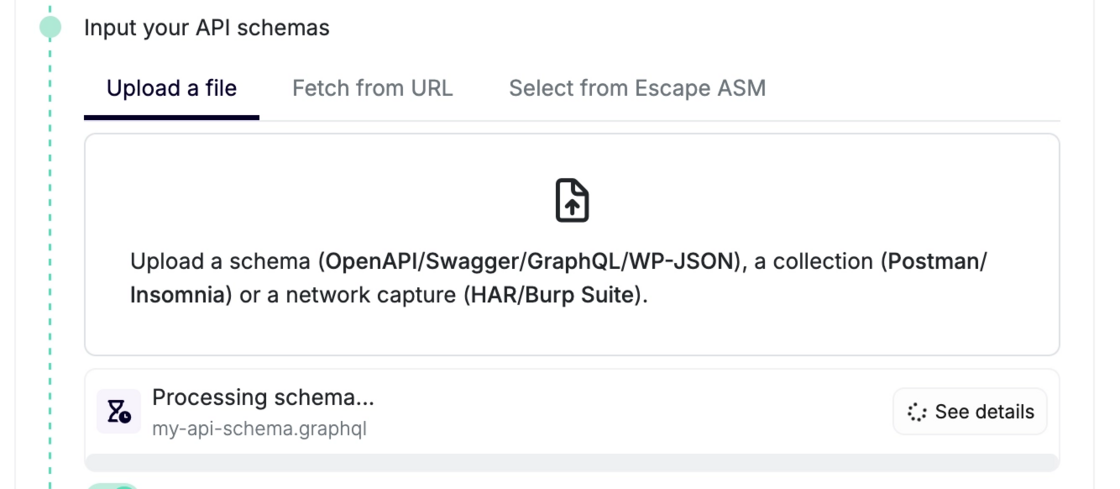
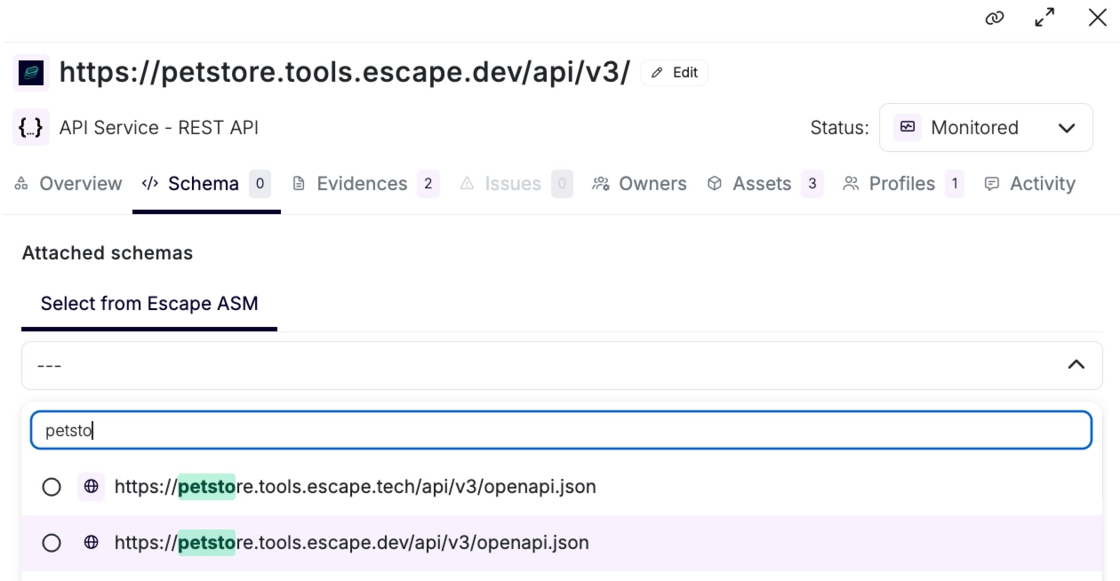
  • Manage schemas from two places. Use the profile's Schemas section in Settings, or the service's side panel in the ASM.
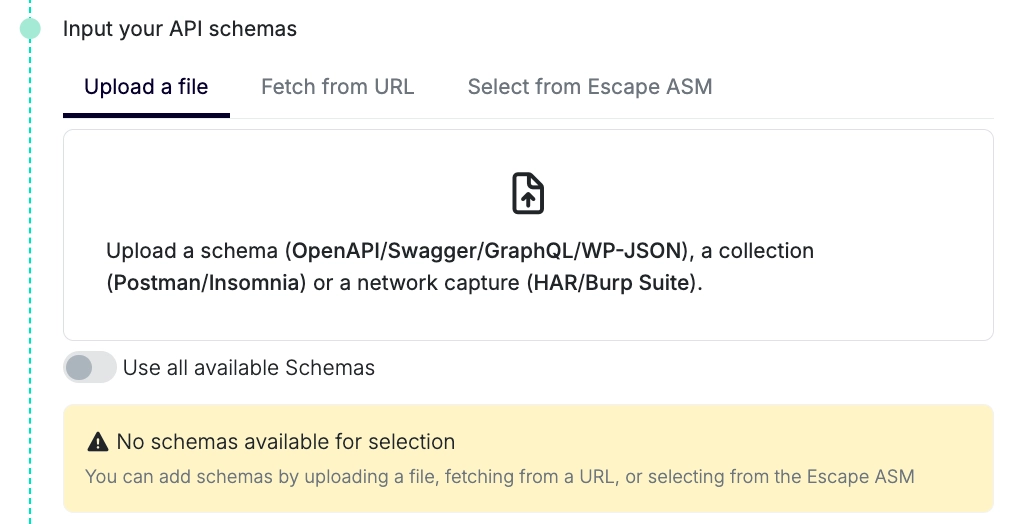
  • Attach schemas during profile creation. Pick from existing assets, or create new ones on the fly via upload, fetch, or directly from the ASM.
  • Scan APIs using multiple schemas. All attached schemas are used during the scan.

How to use it in the UI:

  • During profile creation:
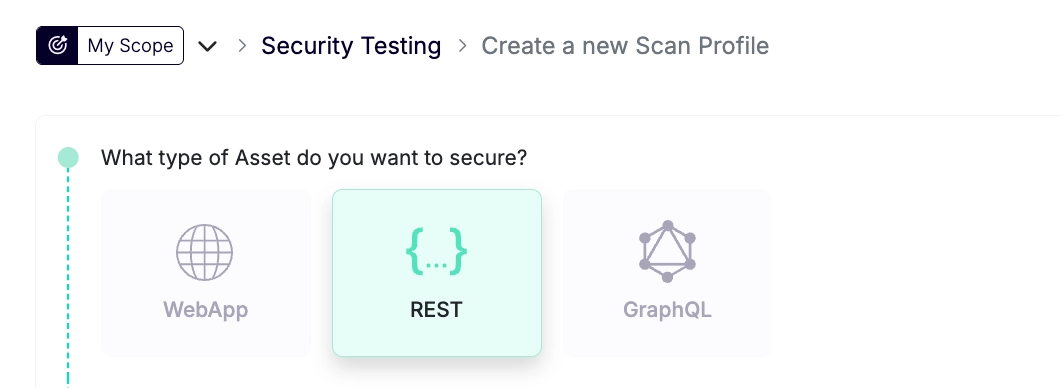
    • Go to the "Create a new scan profile" step and select your API type.

image.png

  • If a schema doesn't appear in the list, it may not be linked to the target asset yet.

image.png

  • Create it on the fly:

image.png

  • or link it first from the ASM:

image.png

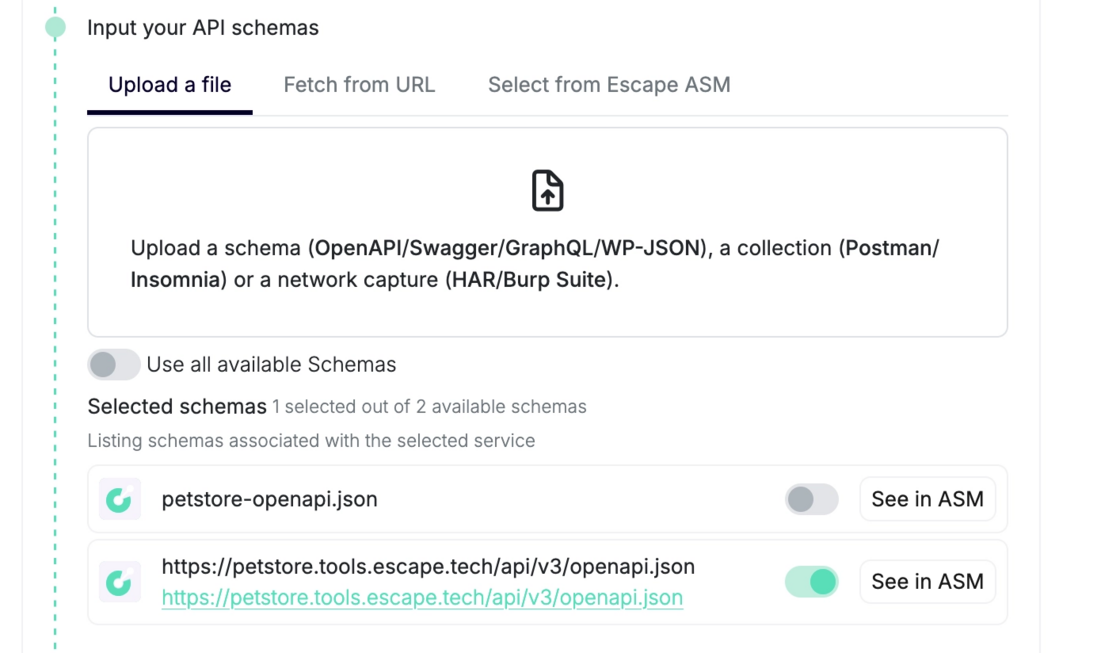
If schema(s) are available, toggle on the schemas you want to include. Check "Use all available extra assets" to always include every linked schema automatically.

image.png

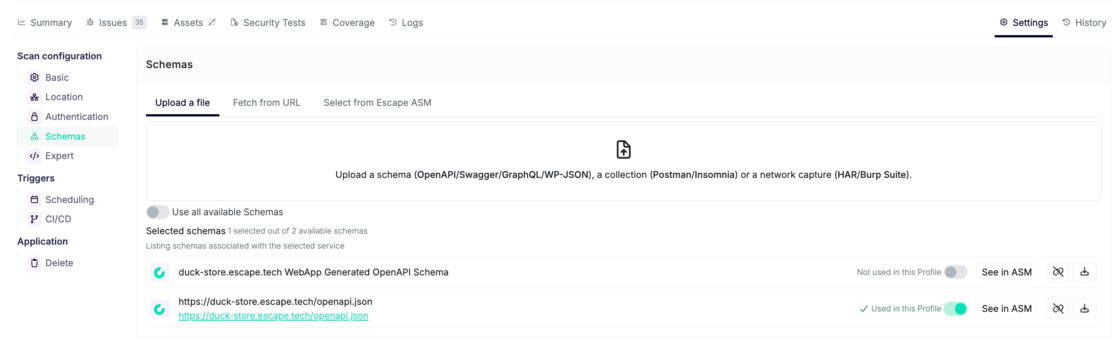
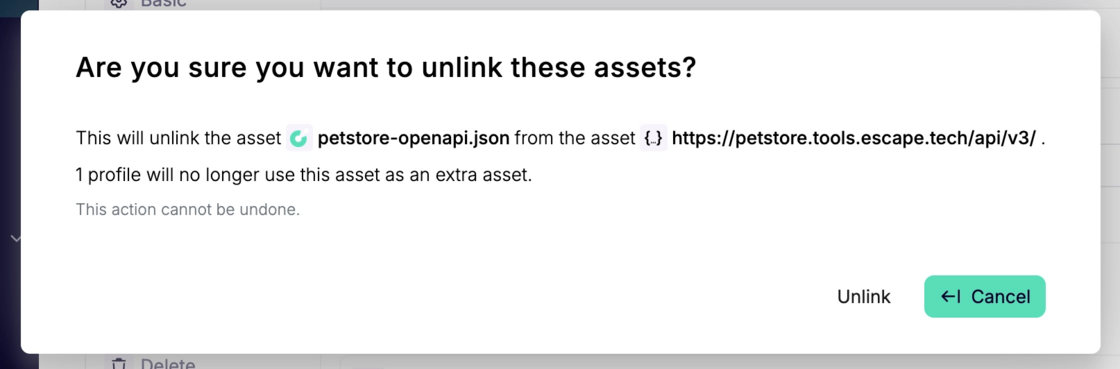
  • For existing profiles: Go to Settings → Schemas. Add, remove, or unlink schemas anytime. Unlinking removes the schema from all profiles scanning that target.

image.png

Unlinking extra schemas from a target asset will require a confirmation and it will remove the asset from the extra assets of all the profiles scanning the target asset.

image.png

The more schemas your scan profile includes, the closer your security coverage gets to your real attack surface.

For extra setup guidance and troubleshooting, learn more in the docs.

#154 · Updated Escape Copilot — Smarter, Faster, More Actionable

Escape Copilot just got a significant upgrade. It now understands your current context, pulls from Escape's documentation, and guides you directly to the right place in the platform.

What's new

  • Page-aware context. Copilot reads your current page. Ask about a vulnerability, a scan, or how to remediate a specific issue you’re reviewing— it already knows which one you mean:

image.png

Grounded in Escape's documentation. Ask anything about the platform and Copilot pulls the answer directly from the official docs. You’ll be always working from accurate, up-to-date guidance:

image.png

image.png

  • Direct links inside the platform. Copilot points you to the exact setting, result, or configuration you need:

image.png

**- Always up to date. **Copilot automatically picks up new Public API features as they ship.

How to use it:

Open Copilot from any page. Just press Cmd + Shift + E (or Ctrl + Shift + E on Windows) to activate Copilot in-app.

Ask in plain language — "what are my most vulnerable profiles?", "how do I remediate this issue?", "how do I configure my firewall?" — and get answers tied to where you are right now.

image.png

We’ve implemented a new thinking model that can perform more complex actions to ensure utmost accuracy. You might experience slower reasoning times but better output.

Try it our now!

#153 · Deeper Attack Surface Detection

Knowing your attack surface starts with finding everything that's exposed. Subdomains are often one of the entry points for attackers.

We've integrated new provider sources and a caching mechanism into our detection engine to address exactly that.

Early results confirm we are now surfacing significantly more subdomains that were previously invisible, with detection increases ranging from 3% to over 229% depending on the end-user environment.

If you're on the ASM product, the new detection logic has already been automatically applied. Nothing to configure!

#152 · New Integrations page with built-in testing, logs, and project-level organization

The Integrations page in Escape has been redesigned to make integrations easier to manage and troubleshoot. You can now configure, test, and monitor integrations from one place, with clear insight into associated assets, execution history, and usage across workflows.

By separating integrations from asset scope and adding built-in testing and logs, it’s simpler to validate changes, debug issues, and keep integrations organized by project as you scale.

What’s new

Standalone integrations

Integrations and asset scope are now managed separately. Domains and IP ranges are handled under ASM Scope Management, while integrations focus only on connectivity and execution.

Configure and manage assets in ASM via Scope Management:

image.png

image.png

Manage integrations independently at a dedicated Integrations page:

image.png

  • Keep scope and connectivity as separate concerns

This makes it easier to reason about what connects vs. what’s being scanned.

Project-level organization

You can now organize integrations based on how your team actually works.

  • Link each integration to a specific project (for example, Brand A)

image.png

  • Create multiple integrations for different environments (staging, prod etc.)
  • Manage integrations independently across teams or setups

Makes it simpler to scale without everything living in one shared config.

Built-in testing

Validate integrations before using them in workflows in a single click on “Test configuration”

image.png

  • Run tests directly from the UI during your initial set up or if you’re making changes.
  • Inspect requests and responses
  • Catch misconfigurations early

Fewer broken workflows and less trial-and-error.

Usage logs

Understand how integrations behave in practice.

  • Click on History on a specific integration’s page and see exact when an integration ran

image.png

  • Identify which workflow triggered it
  • Review in-depth execution history by clicking on a specific pull for debugging

image.png

Your troubleshooting faster and more predictable.

Asset scope insight & export: Helpful for governance and reporting

For Attack Surface Management users: you can now exactly see which assets are associated with each integration.

image.png

And also export associated assets as CSV for audits or reviews:

image.png

Workflow-native messaging integrations

Create Slack, Discord, and other messaging integrations directly inside workflows, where they’re used.

Result: less setup friction and cleaner configuration.

Custom Integrations (on request)

Need something tailored?

Collaborate with the Escape team to design a custom integration built specifically for your use case.

image.png

Why this matters

Previously, integrations were harder to reason about:

  • Limited visibility into dependent assets and workflows
  • Manual debugging when failures occurred
  • Little insight into usage or performance
  • Confusion between asset scope and connectivity

Now, you get:

  • Clear separation between asset scope and integrations
  • Built-in testing to validate configurations
  • Usage logs for debugging and traceability
  • Project-level organization across environments

This makes integrations easier to manage, troubleshoot, and scale as your setup grows.


Learn more in the docs

#151 · Scope Configuration Update – Action Required

We’ve simplified and unified scope configuration across all scanners (ASM + DAST) to make allowlists and blocklists easier to manage.

All scanners now use a single, consistent scope model to define:

  • What should be tested or crawled
  • What should be explicitly allowed or excluded

This brings more consistency, safer defaults, and clearer behavior across frontend, REST, and GraphQL scans.

Each scanner supports:

  • A global scope (shared across scanners)
  • Scanner-specific scope extensions
  • Unified allowlist and blocklist rules (domains, URLs, API paths, GraphQL operations, page elements, etc.)

Below is an example of what changed:

BEFORE
frontend_dast:
  scope:
    api:
      blocklist:
          - ^(?!.*\/api\/v2\/on-call).*
AFTER (AUTO-MIGRATION)
 rest_api_dast:
  scope:
    allowlist: []
    blocklist:
      - type: rest_api_path
        value: ^(?!.*\/api\/v2\/on-call).*
        operation: regex
AFTER (MANUAL MIGRATION WITH WILDCARDS)
rest_api_dast:
  scope:
    allowlist: 
      - type: rest_api_path
        value: "*/api/v2/on-call*"
        operation: wildcard

Action required for customers using scope configuration in CI/CD: you need to upgrade your configuration to the new unified scope format.

Existing configurations were migrated automatically where possible, but CI/CD setups relying on scope definitions must be updated to ensure scans keep working as expected.

For more information on scope configuration, new naming and structure, please refer to our documentation.

#150 · New: Attack Path Validation & Observable API Coverage in Escape

As with web applications, we reworked how Escape represents dynamic security testing coverage across APIs to give you full transparency into the scanner input, so you can confidently verify results and avoid blind spots.

What’s New For APIs (At a Glance)

  • New Coverage page showing all API endpoints actually visited during a scan
  • Advanced filtering by endpoint, severity, method / mutation type, and coverage status
  • HTTP status code visualization to quickly spot error-heavy or unreachable routes
  • Attack Path Validation graph that gives you visibility into Escape’s API exploration engine and helps you ensure that everything found by Escape is interpreted in the correct way and that all the input is valid.
  • Pentesting Summary (Beta) explaining endpoint's purpose and what vulnerabilities found on that endpoint
  • New Logs page with a full, filterable execution trace of the scan

Yes, you can now get full visibility into everything executed during a scan and truly check whether Escape is testing your APIs appropriately. You can find more details on each point below.

Why this matters

After every security scan, you might be left wondering: "Did it actually test our admin endpoints? How did it reach that nested API call? Why didn't it find the vulnerability our pentester discovered?" When auditors, developers, or leadership ask for proof of thorough testing, you're stuck with a vulnerability report and a shrug.

Now, we help your team to answer the following questions:

  • What endpoints were actually tested?
  • How were inputs discovered? Were they discovered well? How were they chained?
  • Did authentication succeed, and where did it fail?
  • Which attack paths succeeded, failed, or were blocked?

This update makes Escape’s exploration and testing fully transparent, end-to-end. You can prove what was tested, troubleshoot gaps instantly, and stop defending your security tooling.

What's New In Details - For API Testing

Coverage Page: Proving What Was Actually Tested

The Coverage page shows every API endpoint visited by the crawler, allowing you to quickly confirm that sensitive routes were actually exercised.

image.png

You can:

  • Search for a specific endpoint or resolver
  • Confirm whether it was tested
  • Immediately see if testing succeeded, partially failed, or was blocked

This lets you answer, with certainty:

Was this endpoint actually exercised during the scan?

You can narrow the list of endpoints by:

  • Associated vulnerability severity

    → focus on endpoints involved in high-impact findings

  • Associated HTTP method (REST) or mutation type (GraphQL)

    → understand how an endpoint was interacted with

  • Coverage status

    → OK, server error, timeout, unreachable, etc.

This is especially useful to:

  • Identify endpoints that consistently error out
  • Spot routes that were reachable but never returned valid responses
  • Understand where configuration issues prevented deeper testing

At the top of the page, Escape visualizes HTTP status codes (200 / 400 / 500 …) in a stacked bar chart. This gives you a fast signal for question like “Are a large number of endpoints returning 400 or 500?”

Attack Path Validation Graphs: Verify that interpreted in the correct way

Coverage page tells you what was reached. Attack Path Validation Graphs show how it was reached, including the initial input. For each endpoint, you can open an Attack Path Validation Graph that exposes the exact execution chain used by Escape to get there.

These graphs help you to understand complete request sequence generated by Escape’s Business Logic Security Testing (BLST) algorithm, an intelligent engine built by the our research team that understands dependencies, extracts dynamic values, and chains requests like an experienced pentester.

What the Graph Shows (Precisely)

Each graph represents:

  • The sequence of requests and responses
  • Dependencies between endpoints
  • Data extraction and reinjection logic used to build valid requests

Extractions and reinjections between different requests are described using jq syntax.

Example (REST API): Chaining Endpoints the Way an Attacker Would

image.png

Imagine an API exposing:

  • GET /books/v1

    → returns a list of books and associated user_id

  • GET /users/v1/{user_id}

    → returns user details

During exploration:

  1. Escape calls GET /books/v1
  2. Extracts user_id values from the response
  3. Reinserts those IDs into GET /users/v1/{user_id}

In the Attack Path Validation Graph, you can see:

  • Where the ID came from
  • How it was validated
  • Which follow-up requests succeeded or failed

Pentesting Summary (Beta)

To complement raw execution data, Escape adds AI-generated summaries per endpoint.

image.png

Exploration Summary (Beta)

This explains endpoint's purpose, business logic, how it was discovered, and which execution path led to it

Useful for:

  • Reviews
  • Knowledge transfer
  • Audits

Pentesting Summary (Beta)

This section focuses on security impact and provides explanations:

  • What vulnerabilities were found
  • Which payloads triggered them
  • Why the behavior is exploitable
  • What an attacker could realistically do

It connects findings directly to execution evidence.

To get access to the AI pentesting summary feature, reach out to your dedicated Escape contact.

As with Web Apps, whether you’re validating a critical admin endpoint, debugging a failed scan, preparing for an audit, or reviewing a production incident, Escape gives you the right evidence.